Building a Climate Dashboard with Apache Pinot and Superset

Monday, September 14, 2020

0*qWW7jpAZqoIg5uN8

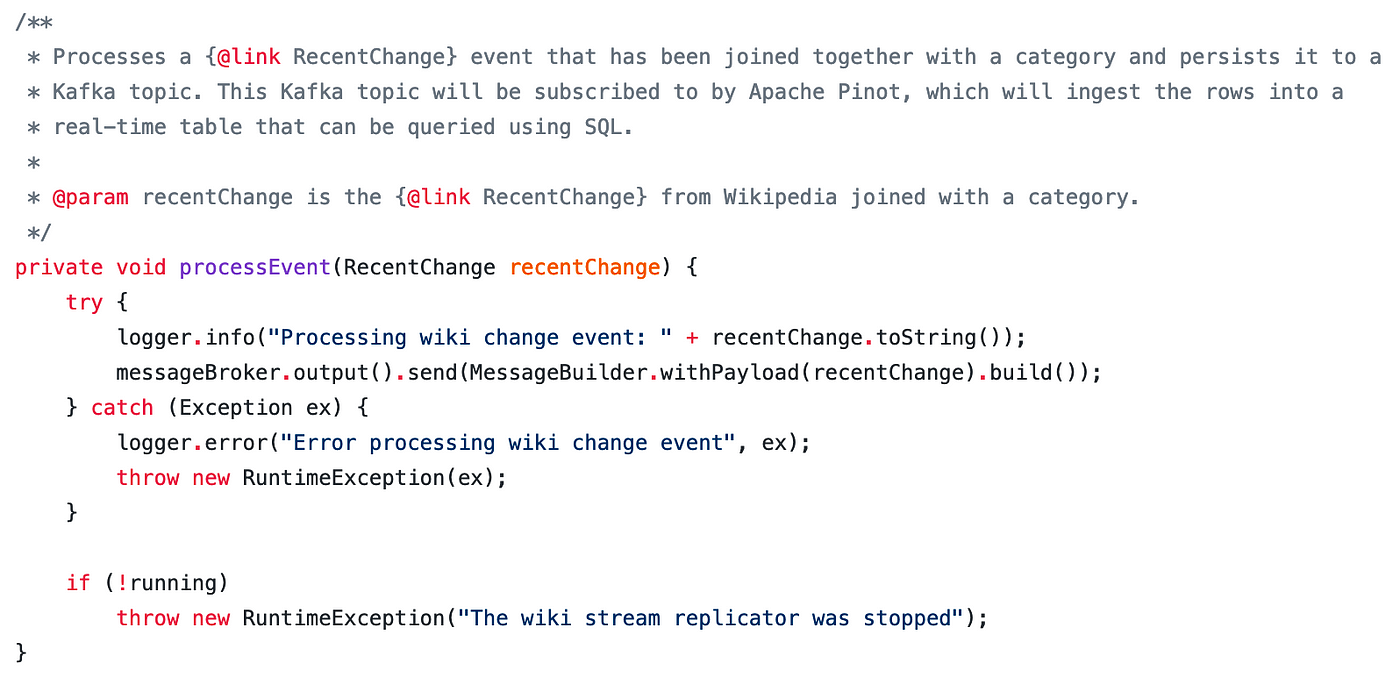
In this blog post, I’d like to show you how Apache Pinot can be used to easily ingest, query, and visualize millions of climate events sourced from the NOAA storm database.

Bootstrap your climate dashboard

I’ve created an open source example which will fully bootstrap a climate data dashboard with Apache Pinot as the backend and Superset as the frontend. In three simple commands, you’ll be up and running and ready to analyze millions of storm events.

Running the dashboard

Superset is an open source web-based business intelligence dashboard. You can think of it as a kind of “Google analytics” for anything you want to analyze.

0*iNgCrPsCQjMe2kqq

After cloning the GitHub repository for the example, go ahead and run the following commands.

$ docker network create PinotNetwork
$ docker-compose up -d
$ docker-compose logs -f — tail=100

After the containers have started and are running, you’ll need to bootstrap the cluster with the NOAA storm data. Make sure you give the cluster enough time and memory to start the different components before proceeding. When things look good in the logs, go ahead and run the next command to bootstrap the cluster.

$ sh ./bootstrap.sh

This script does all the heavy lifting of downloading the NOAA storm events database and importing the climate data into Pinot. After the bootstrap script runs to completion, a new browser window will appear asking you to sign in to Superset. Type in the very secure credentials admin/admin to login and access the climate dashboards.

Analyzing climate data

For this blog post, I wanted to make it as easy as possible to bootstrap a dashboard so that you can start exploring the climate data. Under the hood of this example there are some interesting things going on. We basically have a Ferrari supercar in the form of a real-time OLAP datastore called Apache Pinot doing the heavy lifting.

Pinot is used at LinkedIn as an analytics backend, serving 700 million users in a variety of different features, such as the news feed. The next blog post in this series will focus just on the technical implementation and architecture.

Source data

The data I’ve decided to use for this dashboard is sourced from the NOAA’s National Center for Environmental Information (NCEI). While there are many different kinds of datasets one might want to use as a dashboard for analyzing climate data, the one I’ve chosen to focus on is storm events.

A comprehensive detailed guide of the source data and columns can be found in PDF format here. After running the bootstrap, you can use Apache Pinot’s query console to quickly search through the data, which gives you a pretty good idea about what it contains.

0*FJ zSzdUoTYJmkLP

According to the NCEI website, the Storm Events Database is used to generate the official NOAA Storm Data publication, documenting:

  1. The occurrence of storms and other significant weather phenomena having sufficient intensity to cause loss of life, injuries, significant property damage, and/or disruption to commerce;

  2. Rare, unusual, weather phenomena that generate media attention, such as snow flurries in South Florida or the San Diego coastal area; and

  3. Other significant meteorological events, such as record maximum or minimum temperatures or precipitation that occur in connection with another event.

The database contains millions of storm events recorded from January 1950 to May 2020, as entered by NOAA’s National Weather Service (NWS).

Climate change analysis with Superset

With Superset, you can create your own dashboards using Apache Pinot as the datasource. When creating the dashboards included in this example, I could have spent months on creating cool interactive charts, but to start out I decided to create just a few.

Since the source data contains geolocation coordinates for each storm event, the first thing I thought of visualizing was a map of the US showing all storms since 1950. That was a tad ambitious since there are over 1.6 million storm events.

I decided to implement some yearly filters as well as storm event types. As I played around more with the charting tools in Superset, I figured out how to visualize how many people were injured as a result of each storm event. Below we can see a tornado that injured 30 people, surrounded by many other different types of storms.

0*Io9WANyxN7M6wG5b

As a part of this dashboard, you can now see how many people were injured in any storm event by geographic location within a time period. The storm map also sizes the points on the map and color codes them based on the magnitude of injuries and the type of storm event. In the screenshot above, we have pink circles representing tornado injuries.

Hail and thunderstorm analysis

If anyone was wondering if data science is actual science, the answer is probably no. I spend time creating open source examples and recipes so others can analyze the data without bothering with all the boring infrastructure and software things. Sometimes during this process of creating examples, it feels good to point at some chart and say something exciting about what I find. I encourage more people to do that, whether or not it is scientific to make such claims. There is so much climate data and ways to visualize how it is changing, I think it’s a whole of civilization and societal responsibility to make interesting discoveries.

Here is one example where I discovered an interesting anomaly in the periodicity and intensity of thunderstorm and hail storm seasons.

0*63akFyduSsnvlIyI

What we are looking at here is over twenty-seven thousand hail and thunderstorm events since 1950. Naturally, the count would be seen to be increasing due to better ways to collect the events by the NWS. I spent some time analyzing this chart to understand the implications of what I was seeing. When hail storms and thunderstorms diverge significantly over the span of the seventy years charted out here, it’s possible that there is a correlation between damaging events such as tornadoes, wildfires, droughts, and heat waves. I’m glad I was able to find this visualization, because it does certainly beg questions that a climate scientist might be able to answer.

Storm frequency and seasonal variability

The next visualization I came up with was to see the storm event variation season to season over a period of years.

0*Q1pwniRxAUOK v7Q

This chart is far more palatable than the last one I showed. If anything, it looks super pretty, while also being quite useful. Here we can quickly see anomalies year to year in the volume of certain types of events. One such example is evidence of increased floods in 2018 and 2019. We also see that both extreme cold and excessive heat have been far more prevalent in the last three years. Overall, when analyzing this chart, if things aren’t lining up nicely in equal proportions, that could potentially be a sign of climate change.

Climate heat map

The last chart I came up with for this blog post was the most interesting for both its visual aesthetic and interpretability.

0*4fuD2hroi efq5CV

Above, we have the yearly climate events as a heat map that I’ve grouped by US state and region. The very first thing I noticed is that everything is indeed bigger in Texas, even the storms! The next thing I noticed was that California has started to look similar to Texas in the last six years. Another interesting area worth further exploration is the year 2008 and 2011. Both of these two years show an abnormal increase in storm events that affected every US state and region. There is clearly an answer here for why that is, however, it’s worth more exploration using other kinds of analysis. It would be hard to conclude on any cause just by looking at this chart.

Heat maps like this are great for identifying things to investigate, rather than to make any conclusions.

Conclusion

As a part of this project, I wanted to take the opportunity to craft an example for folks while also teaching myself more about climate change. I’ve found that there is so much to this subject.

Often, I see folks on Twitter toss around the terms climate change and global warming as if these things were as easy to understand as watching one or two documentaries on Netflix. Creating this dashboard gave me an opportunity to understand the hard work that goes into creating both the science and infrastructure necessary to analyze climate data.

Climate change is a broad topic, and global warming is just one part of it. The climate is actually always changing, and it always has been. Some of the world’s hottest and most arid deserts in Africa used to be lakes. In fact, the world today may have never been as hospitable to our lifestyles than it is today. What climate scientists spend their time on is understanding the history of climate change so that they can predict future damage to the many different ecosystems hosting biological life around our world.

Extreme weather events, ones that have a recurring frequency, like hurricanes and tornadoes, happen more or less frequently in areas depending on climate events. When a sudden and unpredicted climate event happens, it may cost billions of dollars and result in many injuries and deaths.

0*zGFvQgHrPZdpHX5q

Next steps

Thanks for reading! Stay tuned for the next blog post that dives deep into the technical bowels of this example to understand how OLAP datastores like Apache Pinot work.

Please share this blog post on social media to get the word out about climate science and climate change. Also, if you’re a scientist and want to work on doing some innovative climate research using Apache Pinot, please reach out to me. I’d love to help.

Real-Time Analysis of Wikipedia Changes Using Apache Pinot and Kafka

Wednesday, May 13, 2020

0*oluSH zlv TFeJwn

If humanity could be caught thinking in real-time, what would it look like? Wikipedia is the closest thing we have to a globally interconnected brain — one that is packed full of knowledge from every corner of the globe — and is always in flux and rarely out of date.

“In the Wikipedia universe, reality cannot be pinned down with finality.”

— James Gleick

Measuring behavior using open source tools

In this blog post we’re going to build a system that does real-time analysis on live changes that are being made across Wikipedia using open source tools.

The source code for this example can be found here.

Wikimedia Event Platform

The Wikimedia foundation is one of the first organizations in the world to create a modern real-time event-driven platform for public use based on Apache Kafka.

0*ue45rhrkDc6D092w

Wikimedia’s Modern Event Platform architecture

In the diagram above (courtesy of Wikimedia) they describe the various components of their event platform. Kafka is at the center of the architecture, and keeps data flowing as events are created by the various Wikimedia properties. Kafka acts as the stateful backbone of their system, allowing the platform to ingest extremely large volumes of events that are capturing the real-time behavior of users on one of the most trafficked websites on the planet.

Querying in Real-time with Apache Pinot

Apache Pinot was created, as was Kafka, at LinkedIn to power analytics for business metrics and user facing dashboards. Since then, it has evolved into the most performant and scalable analytics platform for high-throughput event-driven data. What makes Pinot so powerful is that it plugs right into the kind of system that Wikimedia has built on top of Kafka.

Pinot scales based on the same principles as Kafka when it comes to performance, which makes it a go-to solution for running SQL queries on events that are stored in Kafka topics. There’s no need to mess with custom serializers or to do heavy lifting to support long running applications that perform stream processing.

0*s2kvm9 1w AtuMUA

The Apache Pinot storage model.

Pinot is completely self-service for developers and operators, and provides a storage model that makes sense for modern event-driven platforms. Not only does it scale to the demands of high volume, it was built to scale to the organizational demands of needing to support fast real-time analytics on things happening right now.

Building the application using Spring Boot

The application framework I chose was Spring Boot, which provides a robust solution for reactive streams. Today, Spring continues to evolve, as the oldest possible production deployment of a Spring Boot application would be almost a decade old. To keep pace with the recent demands of modern event-driven applications built on Apache Kafka, the Spring team led the charge back in 2017, having now introduced a fully end-to-end reactive application framework that is integrated across the Spring ecosystem of libraries.

As a result of yet another Spring transformation — this time focused on high performance event-driven applications — emerging patterns for building reactive applications are continually surfacing. Having used Spring Boot for nearly a decade, I decided to put the new reactive goodies to work for analyzing real-time events published by the Wikimedia platform.

The example application’s source code that I discuss in this blog post can be found on GitHub. There you will find more specific instructions for setting up the end-to-end example as well as usage information.

The first thing we’ll do is create a reactive stream that processes recent changes being reported by Wikimedia’s event platform.

1*JSPeeBds v7dy80r 1XFXg

Returns a reactive streams subscriber that processes server-sent events (SSE) from the Wikimedia recent change stream API. (RecentChangeProcessor.java)

Here, I create a stream client that will process each server-sent event that is emitted by the recent change API. Now I have a way to subscribe to the recent changes as they are happening. All changes across Wikipedia go through this pipe, which is at a rate of about 50 changes per second. The next thing I need to do is create a decoration job that will replicate the server-sent events into a Kafka topic that I control.

As a part of my research for putting together the example application discussed in this blog post, I relied on the help of friends. Xiang Fu, one of the co-authors of Apache Pinot, provided me with an insight that helped wrap my head around using Kafka for event-driven data analysis. Xiang made mention that the best way to query immutable events, which may number into the hundreds of millions, and potentially billions, is to not join tables.

Tables have always been a pain to deal with in relational databases, and that’s nothing new. Why we still have tables today is because SQL tends to be the most widely used language for querying data. While it’s probably not the best way to query raw event streams, it turns out to be the best option for business analysts or developers that need to quickly build reports on top of data sources that were originally shaped to fit in tables. This problem is famously known as an impedance mismatch, which simply means that the best model for querying data isn’t always the best model for storing data, which causes us humans to translate between models while sacrificing things like performance, availability, or consistency.

Xiang gave me a new way to think about this. Sometimes you’re not going to have all the data you need in an event stream, and joining real-time data represents a consistency trade off. Take for example the Wikimedia “recent change” API, which has a schema that describes what happened when a user executed a change on a Wikipedia article. These events are being streamed from a Kafka topic and published over HTTP using server-sent events (SSE).

0*SyhRpaXFavxKReAW

I can subscribe to these events, push them into a Kafka topic that I control, and then use that topic to run real-time queries as events arrive into Apache Pinot. The code below can be found in the RecentChangeProcessor.

1*SVNQP1V3MlnEs24JDF0chQ

Gets a reactive stream of recent Wikipedia changes and creates two subscriptions while specifying retries in case of errors from the Wikimedia API. (RecentChangeProcessor.java)

The schema of the recent change feed has a foreign key relationship to other data models on the Wikimedia platform, which in this case, is a changed article’s unique page ID. If I want to make a join in real-time, for example, to be able to query the categories on Wikipedia that are changing the most often, I need to do that using a join that relates a page to its categories. This join is costly because it requires consistency guarantees, which is difficult to do outside of a transactional OLTP database.

0* 78QQyN60A8BKDGD

Decorates the recent change event with its page categories.

Where this problem becomes intractable to solve using an OLTP database, like MySQL, is when real-time analytical queries cause contention with simple lookups that are powering the Wikipedia website.

The solution here is to use immutable event logs without sacrificing performance due to resource contention. To solve this problem with Apache Pinot and Kafka, we’ll use a pattern called event decoration. Event decoration simply adds a property to an event, while forking it to a new Kafka topic that can be ingested by Pinot.

1*dL  JIaFaq3TPkzDdVY HQ

Gets a reactive stream of Wikipedia changes that serialize server-sent events (SSE) before joining each page change with its categories from a separate API. (RecentChangeProcessor.java)

Event decoration is required when you don’t want to sacrifice performance in the face of a join that would require a consistency check. Instead of doing a join between two tables at query execution time, we can decorate an event from a Kafka topic by forking it into a new topic that adds an additional query dimension (such as adding article categories on recent changes).

1*tMrBESxHGDSLpDQdKRQNlQ

For every recent page change from Wikipedia, its categories are fetched (HTTP GET) from a separate API and joined into a new event. This creates multiple category events per page and sends them to a reactive stream subscriber. (RecentChangeProcessor.java)

0*njBSf6ziyHlVE2C

Now that I’ve reactively joined multiple categories to a single Wikipedia change using event decoration, I can finally persist the events I’ve generated by sending it to a topic in Apache Kafka.

1*phLYrU1yz25 saD6irjh0Q

Sends the category change event to a Kafka topic. (RecentChangeProcessor.java)

The next thing I will need to do is create a real-time table in Apache Pinot that will subscribe to these events and ingest each message as a row that we can query using SQL.

Querying in real-time with Apache Pinot

Real-time tables in Apache Pinot are designed to ingest high-throughput events from real-time data sources, such as Kafka. Pinot was designed to perform fast indexing and sharding on real-time data sources so that query performance can scale linearly on a per node basis. What this means is, no matter how many real-time tables you have, the query performance always increases as you add more nodes to a cluster.

0*Z9KbUPmbXEuY1piH

When creating a real-time table, there are two things you need to prepare. First, you have to create a schema that describes the fields that you intend to query using SQL. Typically, these schemas are described as JSON, and you can create multiple tables that inherit the same underlying schema. The second thing you need to create is your table definition. The table definition describes what kind of table you want to create, for instance, for real-time or batch. In this case, we’re creating a real-time table, which requires a data source definition so that Pinot can ingest events from Kafka.

The table definition is also where we describe how Pinot should index the data it ingests from Kafka. Indexing is an important topic in Pinot, as with mostly any database, but it is especially important when we talk about scaling real-time performance. For example, text indexing is an important part of querying Wikipedia changes. We may want to create a query using SQL that returns multiple different categories using a partial text match. Pinot supports text indexing that makes performance extremely fast for queries that need arbitrary text search.

Creating a schema and table

To create a schema and table in Pinot for the real-time Wikipedia change events, I’ve generated two JSON files that can be found in the project’s source on GitHub. The best way to understand how to use Pinot is to look through the documentation, which stays up-to-date and provides various guides and learning resources. You can find the schema and table definition files here that are used in this example.

Since I’ve talked about schemas in a past blog post about analyzing GitHub changes in real-time, I’m only going to quickly go over the table definition file here, which connects to a Kafka topic for real-time Wikipedia changes that are joined by a page’s multiple categories.

0*Wk1QKwaMSEX5IuGu

Here we can see how the real-time table is connected to Kafka, with the topic name “wiki-recent-change”, which I have configured as the output sink in the reactive Spring Boot application.

0*RkhYGKvFZxDiTpH2

Surfacing real-time news in Wikipedia

One of the reasons why I chose to create this application was to see if it was possible to surface real-time news from Wikipedia using Pinot. When looking at the granularity of change events at a high-level, without being able to query by category, it was determined that the noise was just too glaring to infer any kind of real-time news. After decorating the change events with their categories, it became much easier to see how the world, as described by Wikipedia, was changing in real-time.

0*ZwuGzJNXsZJ49PIF

In the screenshot above, you’ll find a word cloud of the most frequently changing categories that were measured over the course of a few hours. Wikipedia editors have a culture of creating categories based on article importance to a particular subject. For instance, what I found really compelling was that each of these categories could be queried to determine what was going on with deeper detail.

0*4wCM0wVzjKrotrXw

Here I am using Apache Superset to query results directly from Apache Pinot. In this query I am wondering why there were so many changes to the category, “Low-importance pulmonology articles”. The results came back with a collection of talk pages, which host discussions for Wikipedia users to debate changes to the page. The patterns started to emerge that it was indeed possible to get a view of both regional and world breaking news using Pinot.

0*f Hj69HKBAHWFPXw

In another query, I wanted to see why there were so many changes being made to high-importance China-related articles. It became clear that all these recent changes to important articles had some kind of relation to discussions on talk pages about the early timeline of the COVID-19 outbreak in China. To get a better view of what is happening inside a particular talk page, you can visit the page and see the comments that are being made. For example, take a look at Talk:COVID-19 Pandemic.

A piece of recent news that I was already aware of from the mainstream media was the COVID-19 related death of Roy Horn from Siegfried and Roy. I decided to run a SQL query to fetch all of the recent changes to articles related to the top-level category “Deaths”. The results did end up returning back top-edits related to “Siegfried and Roy”.

0*04FBlJSx16Hkyojq

In addition to being able to explore real-time breaking news, you can use Apache Superset and Pinot to create real-time dashboards showing how changes are happening on Wikipedia over time.

0*oluSH zlv TFeJwn

For more information about running Apache Superset together with Pinot, check out this blog post.

Conclusion

In this blog post I showed you how to create a real-time change feed from Wikipedia that can be used to analyze and surface breaking news using Apache Pinot. We also walked through how to create a reactive event decoration job that forks Wikipedia change events into a new Apache Kafka topic that joins together changes with their article categories. This example application is exciting, and has many possibilities to be improved upon in the future.

Special thanks

A very special thanks to the Apache Pinot authors and committers that helped me create the example application in this blog post. My thanks goes out to Xiang Fu, Kishore Gopalakrishna, Alex Pucher, Neha Pawar, and Siddharth Teotia.

Using Apache Pinot and Kafka to Analyze GitHub Events

Friday, April 10, 2020

1*eR64jBH1ZvC3uNfPP56p5g

Pinot is the latest Apache incubated project to follow in the footsteps of other tremendously popular open source projects that were first built by engineers at LinkedIn. Pinot joins the likes of Kafka, Helix, and Samza — the former of which is quickly becoming the industry’s message broker of choice for building highly-scalable cloud-native applications.

Outside of LinkedIn, Uber was one of the early adopters of Pinot, using it to power analytics for a variety of use cases such as UberEats Restaurant Manager.

Getting Started with Apache Pinot

In this blog post, we’ll show you how Pinot and Kafka can be used together to ingest, query, and visualize event streams sourced from the public GitHub API. For the step-by-step instructions, please visit our documentation, which will guide you through the specifics of running this example in your development environment.

Pinot Overview

First, let’s do a quick overview of the Pinot components that we’ll be using in this tutorial.

0*jRWx7MMaChnkNl2g

Pinot System Architecture Diagram

Physical components

Zookeeper
Pinot uses Apache Zookeeper to store cluster state and metadata. It is the very first component that needs to come up when creating a Pinot cluster.

Controllers
Controllers maintain the global metadata of the system, with the help of Zookeeper. They manage all other components of the cluster and are responsible for initializing the real-time consumption. Controllers have admin endpoints for managing configs and cluster operations.

Brokers
Brokers handle Pinot queries by forwarding them to the right servers, merging the received results, and sending them back to the client.

Servers
Servers host data segments and serve queries off the hosted data. When the data source is a real-time stream, servers directly ingest from the stream, periodically converting the in-memory ingested data into segments and writing them into the segment store.

Tutorial Overview

Now that you know the basics of Pinot and its architecture, let’s dive into what we’ll be building in this tutorial. Before we review how to ingest GitHub events from Kafka, let’s get familiar with the components we will use to query that data in Pinot. Similar to many NoSQL databases, Pinot has a browser-based query console and REST API. We call this component, the Pinot Controller, and it is the easiest way to run queries outside of a terminal or custom application.

0*u3OICp1rfMO3Ae9

Pinot Controller Start Page

As a part of the Pinot Controller, we provide a query console called the Pinot Data Explorer. If you’re new to Pinot, we have put together a custom docker image and instructions that will help you get up and running as fast as possible.

0*TRL u5mueQli9v l

Pinot Data Explorer

Now that you have a local Pinot cluster up and running, and are able to access the Pinot Data Explorer console. Let’s go over how to create a schema and table that maps a Kafka topic to a queryable data structure in Pinot.

Ingesting GitHub Events with Apache Kafka

Pinot has a variety of ways to ingest data collected from event streams. Today, we’ll be using Apache Kafka to collect event data from GitHub’s public REST API. We chose GitHub events because it is publicly available, there will be a constant stream of events, and it would give us interesting relatable insights about open source projects. We’ll then use Pinot to easily run analytical queries on the aggregate data model that resulted from event streams stored in Kafka topics.

We will be using the /events API from GitHub. In order to get all events related to commits being merged , we are going to collect events of type “PullRequestEvent” which have action == closed and merged == true. For every pull request event that we receive, we will make additional calls to fetch the commits, comments and review comments on the pull request. The URLs to make these calls are available in the payload of the pull request event.

0*wVgLajNFtgTPlxu0

Using the above four payloads, we finally generate a schema for Pinot, with dimensions, metrics and time column, as follows:

1*kTrHl0x2YcOD8luZifVfIQ

GitHub Event Schema for Apache Pinot

Querying GitHub Events with Apache Pinot

Now that we have our schema and table created, Pinot is able to ingest GitHub events from Kafka so that we can query it as a data structure using PQL. Earlier we reviewed the easiest way to query Pinot from a web browser, using the Pinot Data Explorer. Pinot has a SQL-based query language called PQL (Pinot Query Language), which is a declarative query language that gives you a familiar way to interface with data. It’s important to mention that PQL is based on SQL, and shares much of its semantics, but is not intended to be used for database transactions or writes.

After firing up the Pinot Data Explorer, you’ll be able to run a PQL query to fetch data from the GitHub events that are being ingested in realtime.

0*JrCX2akz6jDaQk5w

Query GitHub Event Schema in Pinot Data Explorer

From here, there are many different ways to interface and visualize the real-time event data from GitHub. One such way is to create a chart using Apache Superset, which is a popular open source web-based business intelligence tool. This is a common tool used to create reports that visualize Pinot data queried with PQL.

0*B8zBeHHAy CHTldf

Querying GitHub Event Data from Pinot in Superset

You can find more details and instructions on using Superset with Pinot from this community blog post.

Conclusion

In this tutorial we introduced you to using Kafka and Pinot to analyze, query, and visualize event streams ingested from GitHub. Please visit our documentation for the comprehensive step-by-step tutorial referenced in this blog post.

If you’re interested in learning more about Pinot, become a member of our open source community by joining our Slack channel and subscribing to our mailing list.

We’re excited to see how developers and companies are using Apache Pinot to build highly-scalable analytical queries on real-time event data. Feel free to ping us on Twitter or Slack with your stories and feedback.

Finally, here is a list of resources that you might find useful as you start your journey with Apache Pinot.

Special thanks

A very special thanks to Neha Pawar and the Apache Pinot engineering team for co-authoring this blog post. If you’re interested in co-authoring or contributing an article to our developer blog, please reach out to @kennybastani on Twitter.