What Graph Analysis of Wikipedia Tells Us About the Relevancy of Recent Knowledge

Sunday, December 7, 2014

The chart below was generated using data analyzed with a Neo4j Graph Database and Apache Spark GraphX. 10.9 million Wikipedia articles and 110 million hyperlinks were analyzed to produce a PageRank and Triangle Count for each node in the graph. The Triangle Count metric is a measure of clustering, while the PageRank metric is a measure of relevancy.

Knowledge moves forward in time

Every year through 1850—2012 on the X-axis represents a Wikipedia page that describes historical events and facts about that calendar year. Link analysis was performed on the inbound and outbound hyperlinks for each page and all other pages in the graph that contribute to that page's relevancy.

The chart describes a probability distribution over time. This distribution indicates that if a person were to randomly click hyperlinks starting from any page on Wikipedia, the person would move towards articles with a higher closeness centrality to Category:Year pages occurring later in the timeline.

When it comes to our collective human knowledge, as time moves forward, distant history becomes inversely relevant to more recent events in our timeline.

To see this pattern you can click and drag areas of the chart to zoom in. You'll notice the pattern is local as well as global.

Why is the year 2000 so relevant?

Wikipedia, the world's largest encyclopedia of human knowledge, was first launched on January 15th, 2001.

Links

A Docker Image for Graph Analytics on Neo4j with Apache Spark GraphX

Thursday, November 27, 2014

I've just released a useful new Docker image for graph analytics on a Neo4j graph database with Apache Spark GraphX. This image deploys a container with Apache Spark and uses GraphX to perform ETL graph analysis on subgraphs exported from Neo4j. This docker image is a great addition to Neo4j if you're looking to do easy PageRank or community detection on your graph data. Additionally, the results of the graph analysis are applied back to Neo4j.

This gives you the ability to optimize your recommendation-based Cypher queries by filtering and sorting on the results of the analysis.

Photo credit AMPLab Berkley

Using Apache Spark and Neo4j for Big Data Graph Analytics

Monday, November 3, 2014

As engineers, when we think about how to solve big data problems, evaluating technologies becomes a choice between scalable and not scalable. Ideally we choose the technologies that can scale to a variety of business problems without hitting a ceiling down the road.

Database technologies have evolved to be able to store big data, but are largely inflexible. The data models require tedious transformations and shuffling around of data. This is a complex process that is compounded in its complexity by combining a variety of inflexible solutions and platforms.

Fast and scalable analysis of big data has become a critical competitive advantage for companies. There are open source tools like Apache Hadoop and Apache Spark that are providing opportunities for companies to solve these big data problems in a scalable way. Platforms like these have become the foundation of the big data analysis movement.

Still, where does all that data come from? Where does it go when the analysis is done?

Deep Learning Sentiment Analysis for Movie Reviews using Neo4j

Monday, September 15, 2014

While the title of this article references Deep Learning, it's important to note that the process described below is more of a deep learning metaphor into a graph-based machine learning algorithm. No neural networks are used.

Sentiment analysis uses natural language processing to extract features of a text that relate to subjective information found in source materials.

Movie Review Sentiment Analysis

A movie review website allows users to submit reviews describing what they either liked or disliked about a particular movie. Being able to mine these reviews and generate valuable meta data that describes its content provides an opportunity to understand the general sentiment around that movie in a democratized way. That’s a pretty cool thing if you think about it. Using machine learning we can democratize subjectivity about anything in the world. We can make an objective analysis of subjective content, giving us the ability to better understand trends around products and services that we can use to make better decisions as consumers.

Using a Graph Database for Deep Learning Text Classification

Tuesday, August 26, 2014

Graphify is a Neo4j unmanaged extension that provides plug and play natural language text classification.

Graphify gives you a mechanism to train natural language parsing models that extract features of a text using deep learning. When training a model to recognize the meaning of a text, you can send an article of text with a provided set of labels that describe the nature of the text. Over time the natural language parsing model in Neo4j will grow to identify those features that optimally disambiguate a text to a set of classes.

Feature Hierarchy

Understanding How Neo4j Cypher Queries are Evaluated

Wednesday, July 9, 2014

There are many ways to store and manage data within a Neo4j graph database. When Neo4j 2.0 launched late last year we had an entirely new browser experience for interacting with graphs. The graph visualization from the return results of Cypher queries were at the core of the user experience enhancements to the platform.

Using 3D Visualization to Debug a Graph-based Algorithm

Monday, July 7, 2014

Recently I have been working on an idea for an algorithm that discovers patterns in raw streams of data. This pattern recognition algorithm uses deep learning to classify certain combinatorial features that uniquely identify an input stream.

I'm going to first talk a bit about the algorithm so it makes sense as to why visualization is such an important step in iterating and tweaking code that most efficiently implements the algorithm.

The Algorithm


In a previous post I introduce the idea for the algorithm and how a graph-based approach might work.

Hierarchical Pattern Recognition

Tuesday, June 17, 2014

About a year ago I read about Ray Kurzweil's "Pattern Recognition Theory of Mind", which he articulates in his book, "How to Create a Mind". I picked up the book after struggling with the idea of implementing a deep learning algorithm for parsing natural language text on Wikipedia. My goal was to discover links in volumes of text that were not already linked. I ended up developing all kinds of cool heuristics to do this, mostly by a lot of trial and error. King of these heuristics was a pretty simple algorithm at the core of the library that would find redundancies in batches of text content. 

How this worked is if a phrase was mentioned repeatedly in a collection of about 50 sentences, then I could extract that phrase as a node and link it back to the pieces of content it belonged to. Every now and then you'll get a reference to another article's name, which can then be verified against Wikipedia's site index, which would provide more sentences to find repeated phrases within.

I struggled with persistency because I knew how ugly my problem was for a relational database. I created some entity-relationship models, and implemented them using Entity Framework over Microsoft SQL Server. It worked, kind of. I waited patiently to happen upon a better solution. Thankfully I did, and using a graph database I was able to take my cool little algorithms and solve my persistency problem at scale.

Building a Neo4j Reporting Service Part II

Wednesday, April 30, 2014


It is a capital mistake to theorize before one has data. Insensibly one begins to twist facts to suit theories, instead of theories to suit facts.

Sir Arthur Conan Doyle, Author of Sherlock Holmes stories
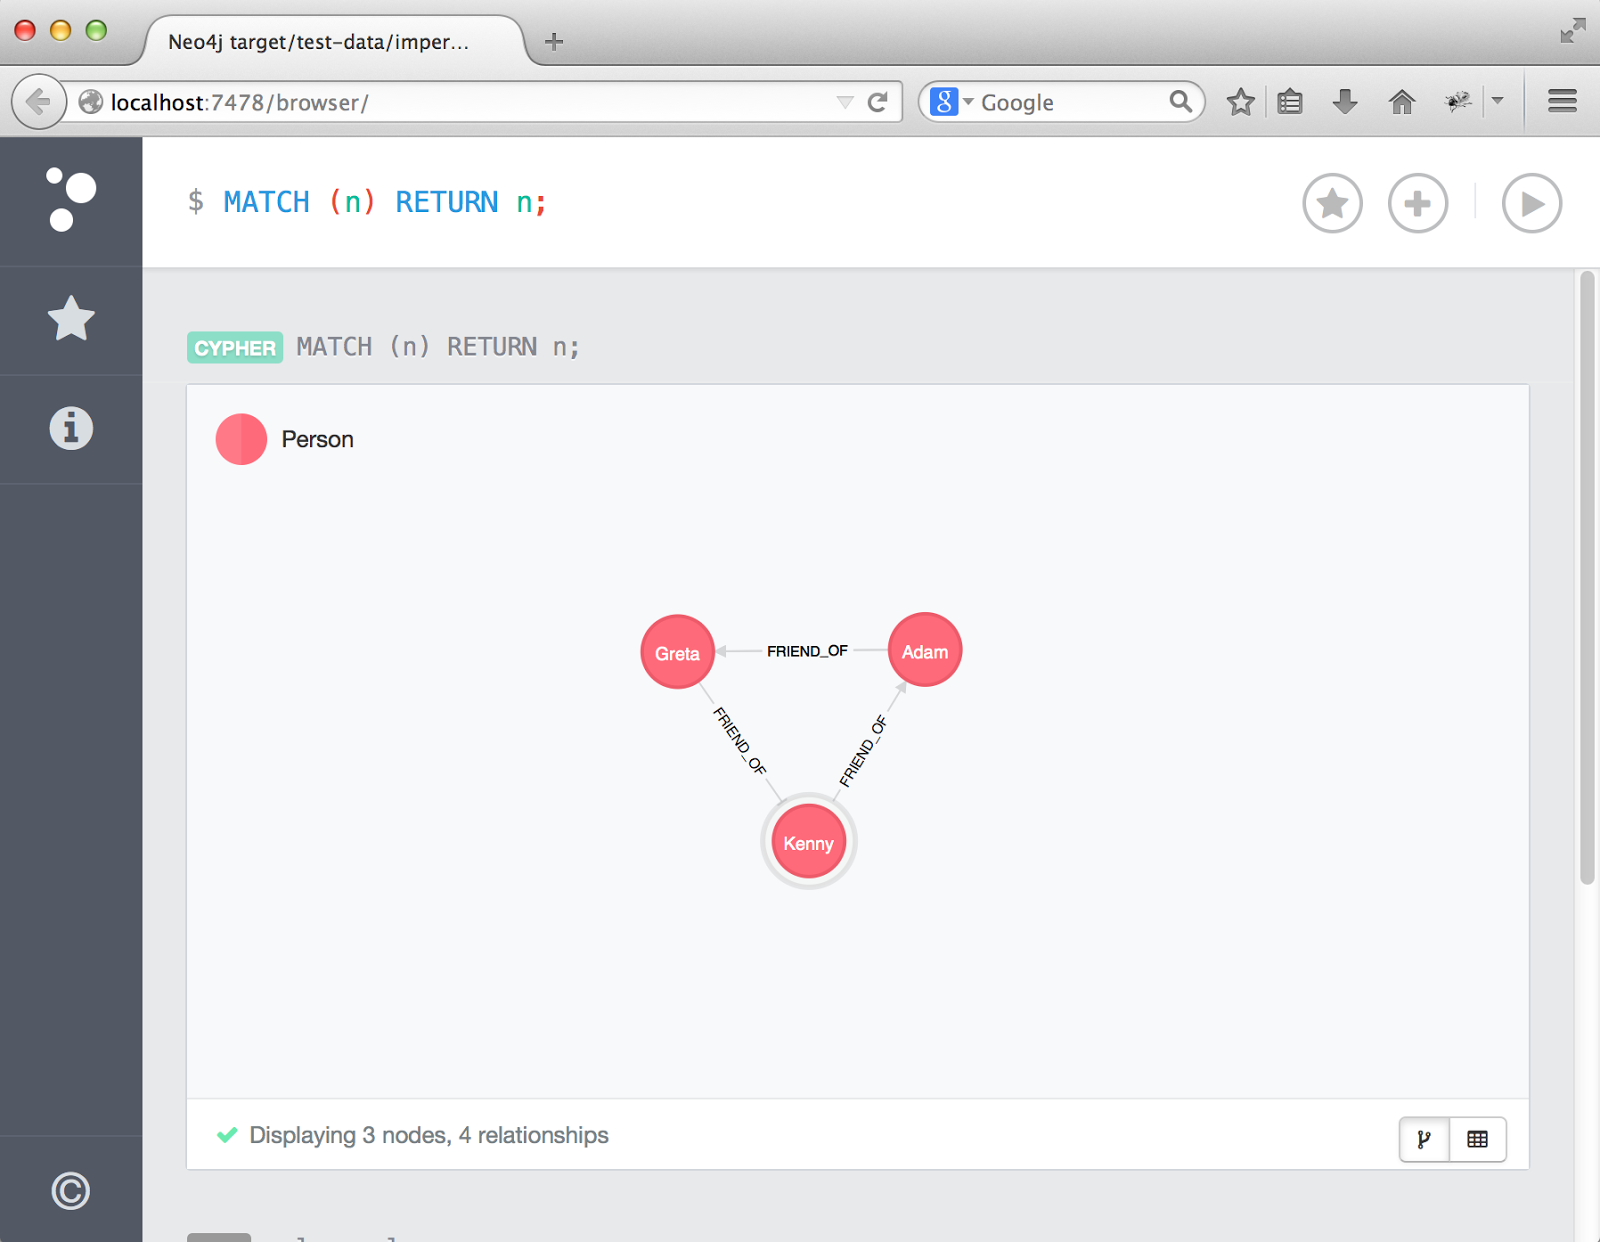
A Subgraph From Neo4j's Browser
Just as Sir Arthur Conan Doyle's character, Sherlock Holmes, manically collects facts and evidence to prove theories, we find ourselves doing much of the same today except on a much larger scale web scale. The web is an ever growing expanse of facts and evidence. It is at our disposal to observe without much of a challenge, but to store it and retrieve it in a way that answers the big questions, that's challenging.

Continuing on from Building a Graph-based Reporting Platform: Part I, I posed some questions related to understanding how to build great community experiences around Neo4j using Meetup.com for local events. I presented an idea to use Neo4j to build a platform that could help us understand the demand for presenting compelling content at events.

Compelling content is at the core of great community experiences. That content fuels the conversations between people, ideas begin to flow, and innovation is born.

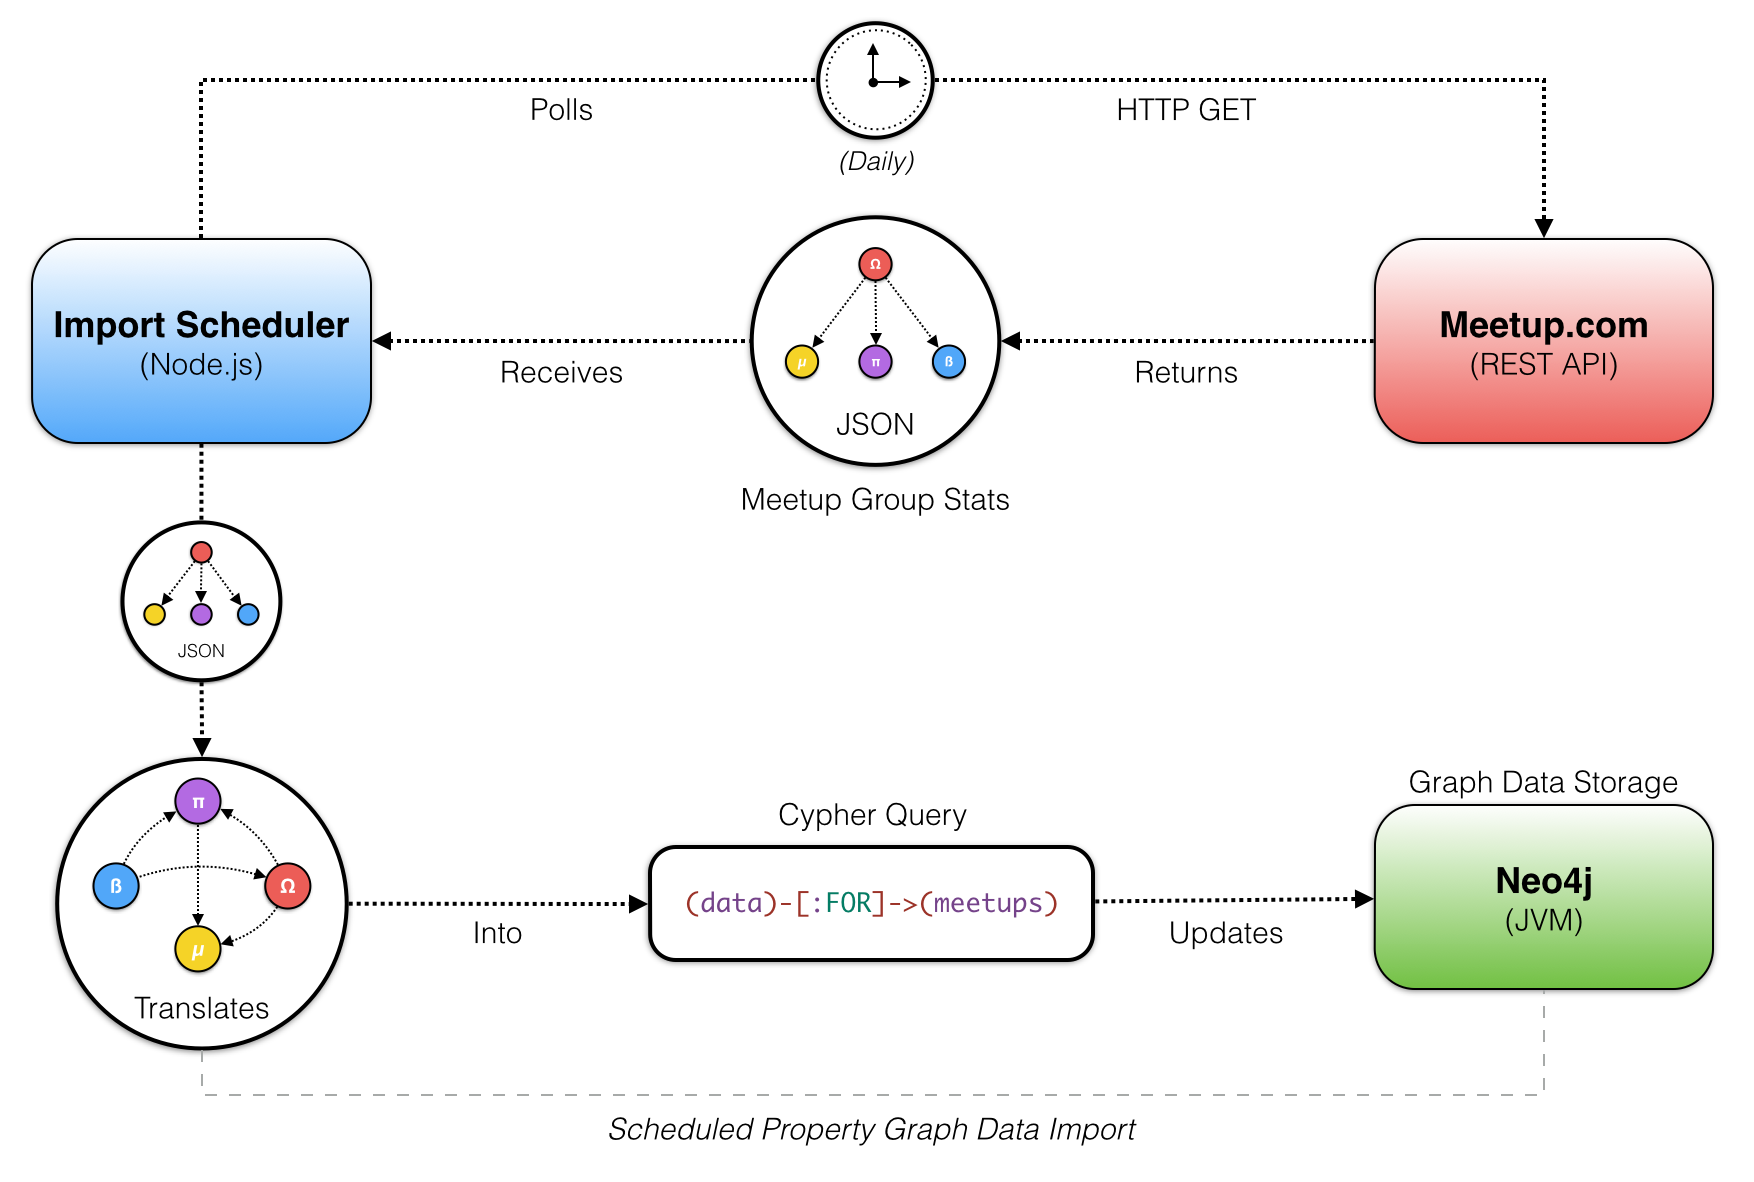
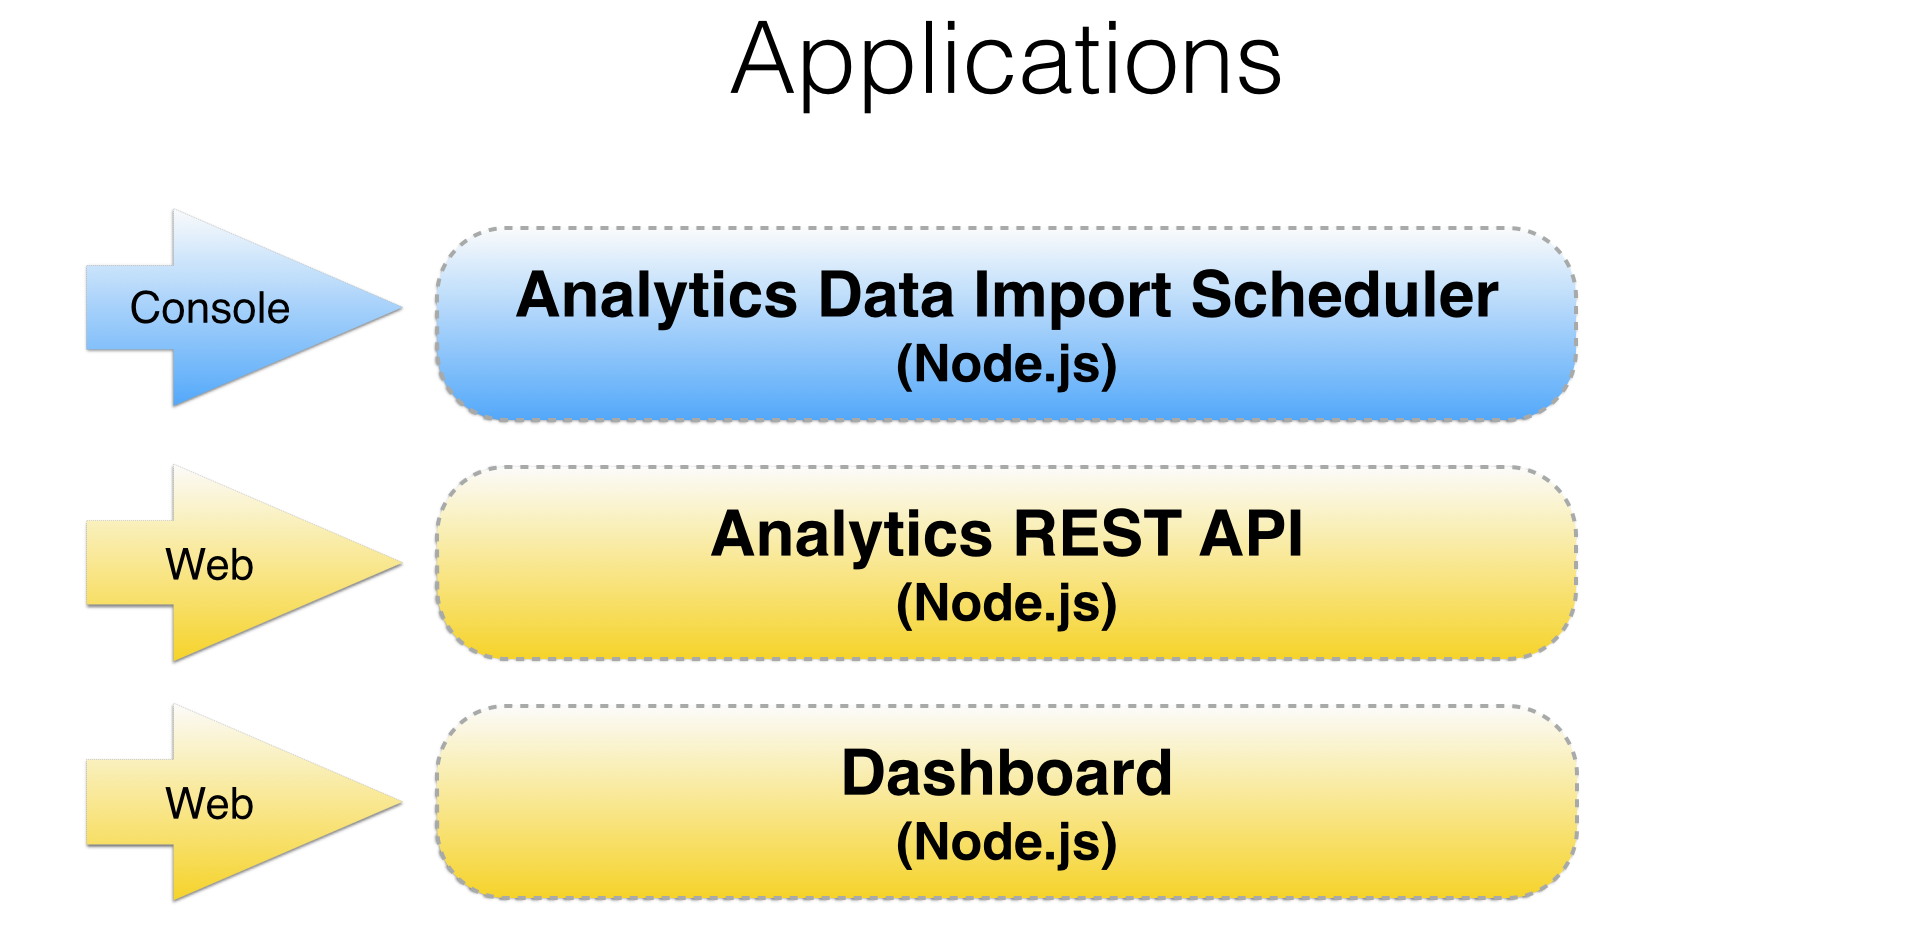
My idea was to build an open-source platform that would poll public APIs, translate collected data into a graph, and store it in a graph database to be analyzed, queried, and visualized over time. The first component of this architecture is the Data Import Scheduler, which this post describes in detail.

Polling Data From Public APIs

Let's start out by answering a basic question.

What does the data import scheduler do?
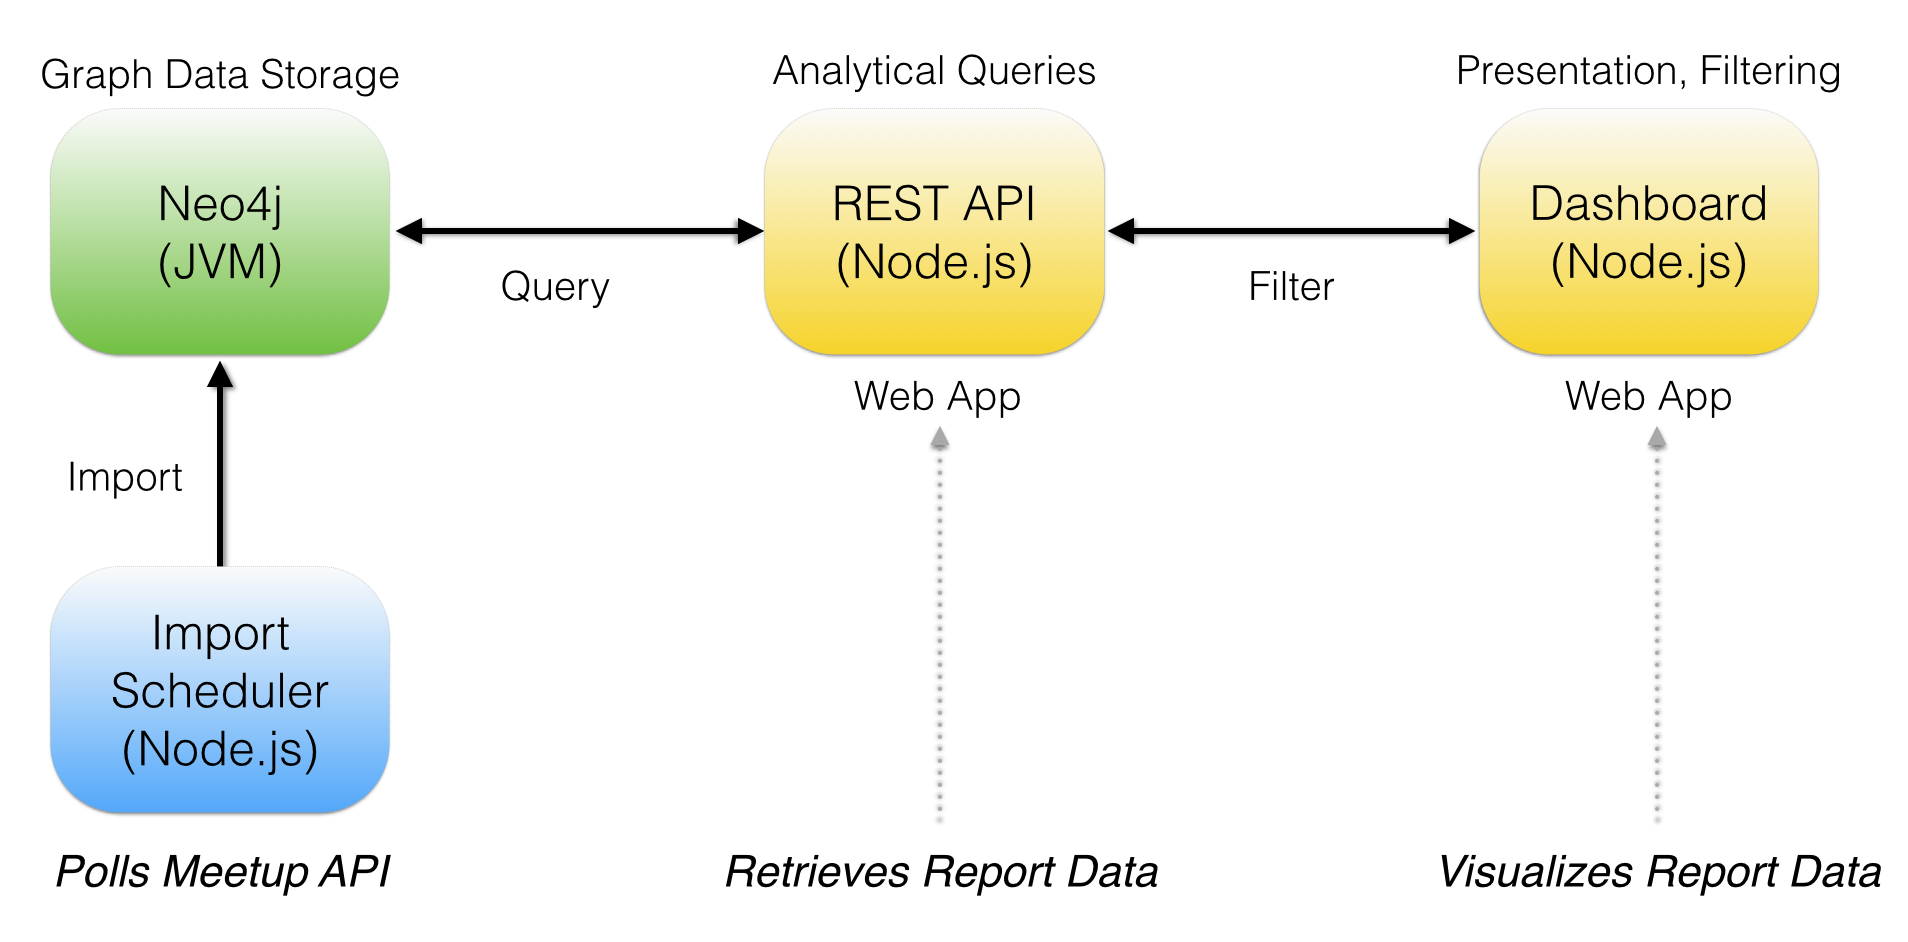
The analytics data import scheduler is a Node.js process that can be hosted for free on Heroku and is responsible for collecting time-based statistics from a public API. In this case, the Meetup.com REST API exposes a set of methods that provide a momentary snapshot into the number of members that a group has at the time of the request. The data import scheduler polls this endpoint once a day to retrieve Meetup group statistics to later be used for time-based analysis from our graph database, Neo4j.

As illustrated in the diagram below, the Node.js application wakes up once a day and checks in with the Meetup.com REST API.


The scheduler process polls Meetup.com's REST API daily. An HTTP GET request is dispatched for each city we're tracking, returning a JSON formatted response for groups in those cities. The JSON data for each group is then translated into a subgraph, formatted as Neo4j's Cypher query language. The Cypher query is then sent as a transaction to Neo4j and updates a snapshot of the group's stats for that day.

Importing a Meetup Group's Subgraph

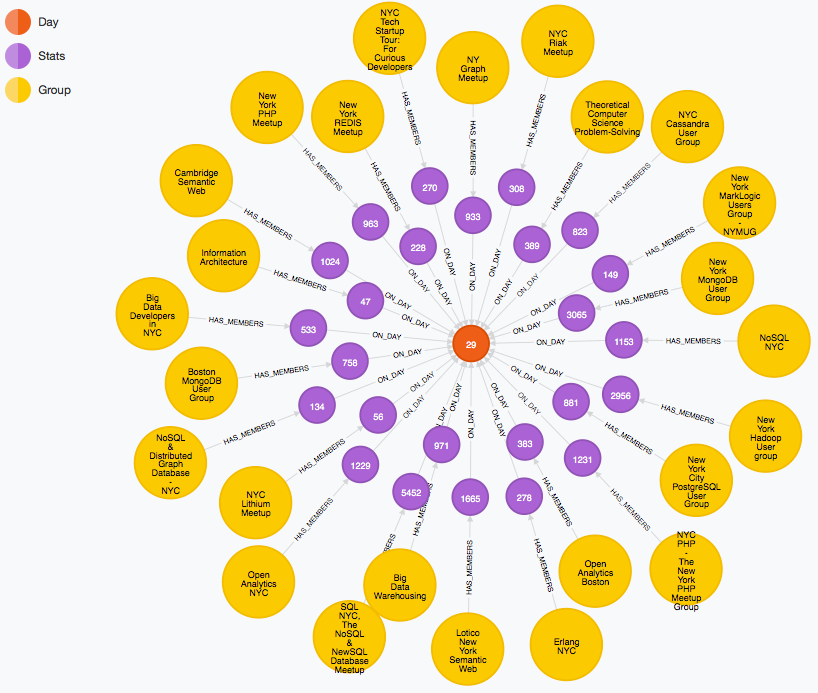
The image below is a visualization of a Meetup group's subgraph, translated from JSON data polled on an arbitrary date.

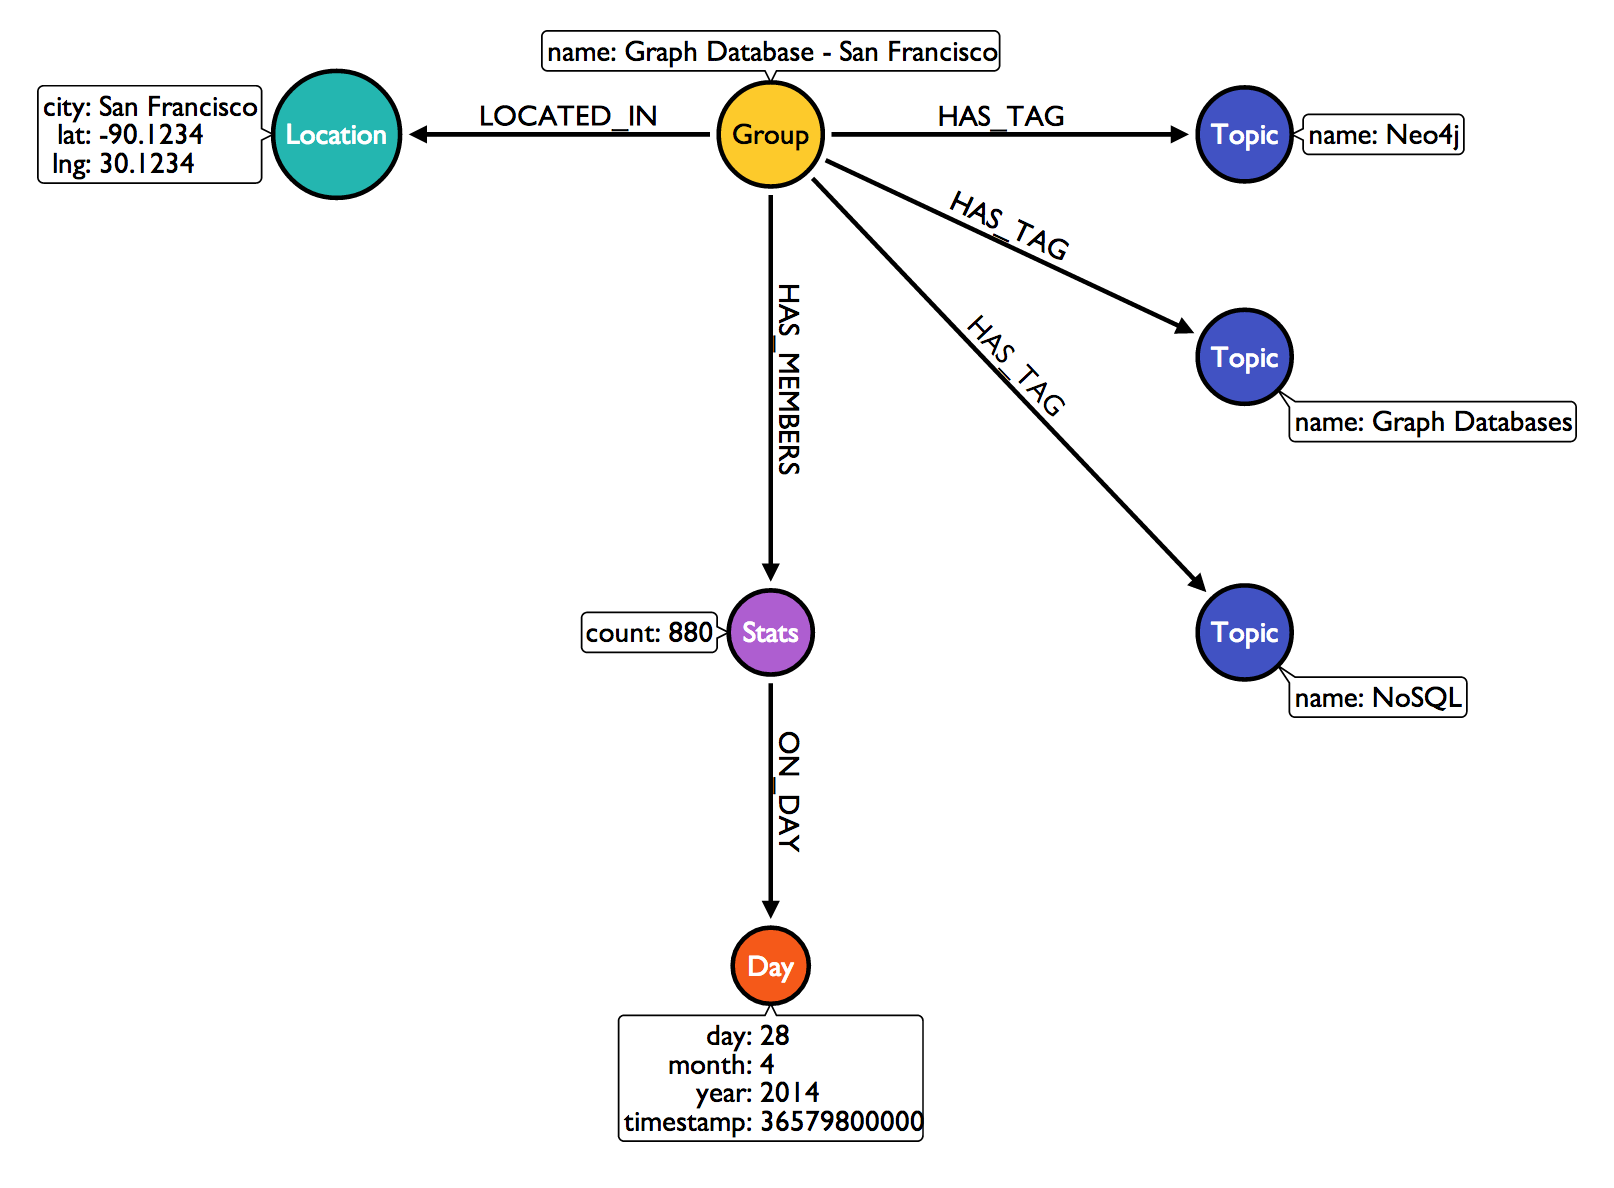
Graph Database - San Francisco on 4/28/2014

We see that the group has a set of topic nodes, which may already exist within the database. The subgraph must be merged into the larger graph without duplicating any nodes. Using Cypher's MERGE clause we can get or create nodes, which is useful for expanding our graph's connected data. Each topic will collect more groups as new subgraphs are merged for daily imports. The same is also true for both day and location nodes.

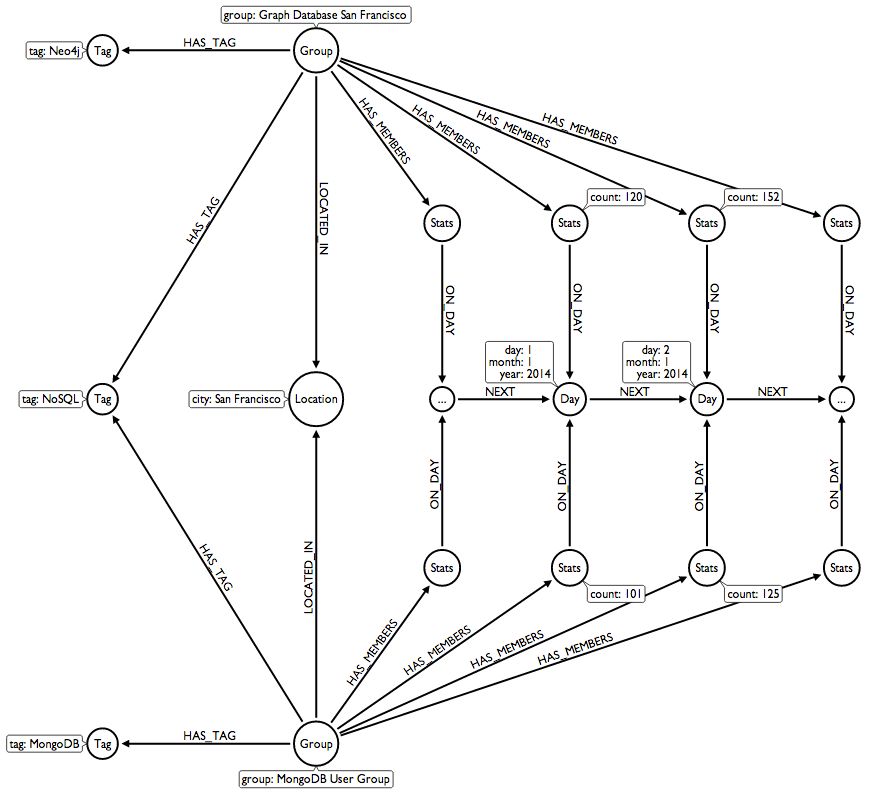
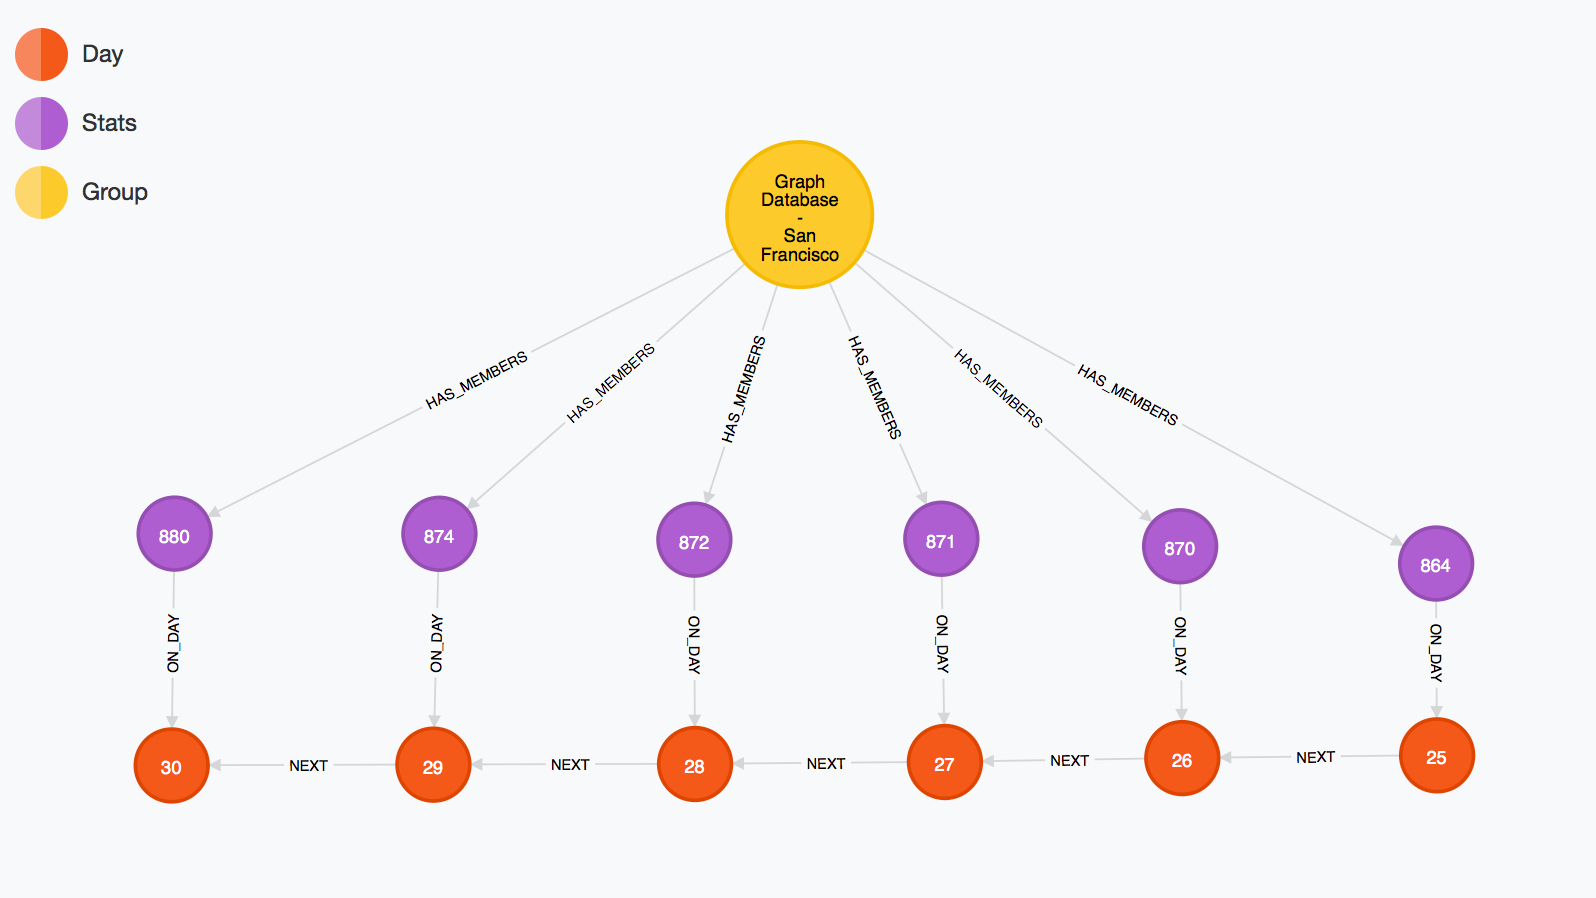
After a few days of scheduled imports, a group's subgraph begins to take shape. As day nodes are connected to the previous day's node, membership statistics are connected.

Neo4j Data Import Model
A Meetup Group Statistics Subgraph, 4/23 to 4/28

The data import scheduler application is open-source and available on GitHub. Also, full documentation is available to help you get started with customizing your own graph-based reporting platform.

All analysis on the temporal stats collected from the data import scheduler is performed within the REST API module of the reporting platform. It also safely exposes the graph database to a front-end web dashboard, consumed from client-side JavaScript. The REST API uses Swagger, which is a specification and complete framework for describing, producing, consuming, and visualizing RESTful web services.

Building a Neo4j Reporting Service Part I

Thursday, April 24, 2014

Data science is pretty hot right now. The obvious reason is that data is rapidly expanding in complexity and size. There is an opportunity to be had in building systems that can capture this data, classify it in multiple dimensions, and to scale it up to the demands of analysts looking to convert data into valuable reports.


As a developer evangelist for Neo4j, I am frequently out in the community talking about things I build using our database. We use Meetup.com to schedule and promote our community events all over the world.

If you're unfamiliar with Meetup.com, here is a description from their Wikipedia entry:

"Meetup is an online social networking portal that facilitates offline group meetings in various localities around the world. Meetup allows members to find and join groups unified by a common interest, such as politics, books, games, movies, health, pets, careers or hobbies. Users enter their postal code or their city and the topic they want to meet about, and the website helps them arrange a place and time to meet. Topic listings are also available for users who only enter a location."

At Neo4j, we're obsessed with data, especially connected data. We believe in our product because we use it to solve our own problems every day. With something like Meetup.com, we found ourselves guessing about many of the aspects of our community and how we could do a better job creating a great community experience.

Some of those questions were:
  • How many people will show up to an event from the attendee list?
  • What kind of content are people interested in hearing about?
  • What's the best location to host our meetups to boost attendance?

I wanted to use Neo4j to do reporting. I decided to put together a platform to track some of this information and build some reports to visualize the data we collected. I started by breaking down the problem into a set of stories to be implemented as a report.

Problem

  • Track meetup group growth over time
  • Apply tags to meetup groups and report combined growth of all groups over time

Questions

  • Given a start date and an end date, what is the time series that plots the membership growth of a given meetup group?
  • Given a start date, an end date, and a combination of tags, what is the time series that plots the combined membership growth of all meetup groups with those tags?
  • How do you generate the JSON data of a time series for a basic JS line chart plugin?

I decided to start with a GraphGist, which is an open source project we built to enable our community to put together a quick proof of concept using our database.

Neo4j for Graph Analytics: Meetup.com Example

I designed an example graph data model, which I then translated into Neo4j's Cypher query language to create an example dataset.


Now it was time to scale it up to a full platform. I decided to use Node.js.


There would be three Node.js driven components. One console application for importing data on a schedule and two web applications; a dashboard for displaying reports and REST API to communicate with the Neo4j graph database.


With an architecture in place, I went forward with building out each of the modules.

In my next blog post I will go through the details of building the import scheduler, which polls the Meetup.com API each day and imports the graph data model into Neo4j.

Feel free to take a look at the finished documentation which details the creation of each of the Node.js modules:

Graph-based Reporting Documentation

Also, I put a slide deck together: