Showing posts with label analytics. Show all posts

Using Apache Pinot and Kafka to Analyze GitHub Events

Friday, April 10, 2020

1*eR64jBH1ZvC3uNfPP56p5g

Pinot is the latest Apache incubated project to follow in the footsteps of other tremendously popular open source projects that were first built by engineers at LinkedIn. Pinot joins the likes of Kafka, Helix, and Samza — the former of which is quickly becoming the industry’s message broker of choice for building highly-scalable cloud-native applications.

Outside of LinkedIn, Uber was one of the early adopters of Pinot, using it to power analytics for a variety of use cases such as UberEats Restaurant Manager.

Getting Started with Apache Pinot

In this blog post, we’ll show you how Pinot and Kafka can be used together to ingest, query, and visualize event streams sourced from the public GitHub API. For the step-by-step instructions, please visit our documentation, which will guide you through the specifics of running this example in your development environment.

Pinot Overview

First, let’s do a quick overview of the Pinot components that we’ll be using in this tutorial.

0*jRWx7MMaChnkNl2g

Pinot System Architecture Diagram

Physical components

Zookeeper
Pinot uses Apache Zookeeper to store cluster state and metadata. It is the very first component that needs to come up when creating a Pinot cluster.

Controllers
Controllers maintain the global metadata of the system, with the help of Zookeeper. They manage all other components of the cluster and are responsible for initializing the real-time consumption. Controllers have admin endpoints for managing configs and cluster operations.

Brokers
Brokers handle Pinot queries by forwarding them to the right servers, merging the received results, and sending them back to the client.

Servers
Servers host data segments and serve queries off the hosted data. When the data source is a real-time stream, servers directly ingest from the stream, periodically converting the in-memory ingested data into segments and writing them into the segment store.

Tutorial Overview

Now that you know the basics of Pinot and its architecture, let’s dive into what we’ll be building in this tutorial. Before we review how to ingest GitHub events from Kafka, let’s get familiar with the components we will use to query that data in Pinot. Similar to many NoSQL databases, Pinot has a browser-based query console and REST API. We call this component, the Pinot Controller, and it is the easiest way to run queries outside of a terminal or custom application.

0*u3OICp1rfMO3Ae9

Pinot Controller Start Page

As a part of the Pinot Controller, we provide a query console called the Pinot Data Explorer. If you’re new to Pinot, we have put together a custom docker image and instructions that will help you get up and running as fast as possible.

0*TRL u5mueQli9v l

Pinot Data Explorer

Now that you have a local Pinot cluster up and running, and are able to access the Pinot Data Explorer console. Let’s go over how to create a schema and table that maps a Kafka topic to a queryable data structure in Pinot.

Ingesting GitHub Events with Apache Kafka

Pinot has a variety of ways to ingest data collected from event streams. Today, we’ll be using Apache Kafka to collect event data from GitHub’s public REST API. We chose GitHub events because it is publicly available, there will be a constant stream of events, and it would give us interesting relatable insights about open source projects. We’ll then use Pinot to easily run analytical queries on the aggregate data model that resulted from event streams stored in Kafka topics.

We will be using the /events API from GitHub. In order to get all events related to commits being merged , we are going to collect events of type “PullRequestEvent” which have action == closed and merged == true. For every pull request event that we receive, we will make additional calls to fetch the commits, comments and review comments on the pull request. The URLs to make these calls are available in the payload of the pull request event.

0*wVgLajNFtgTPlxu0

Using the above four payloads, we finally generate a schema for Pinot, with dimensions, metrics and time column, as follows:

1*kTrHl0x2YcOD8luZifVfIQ

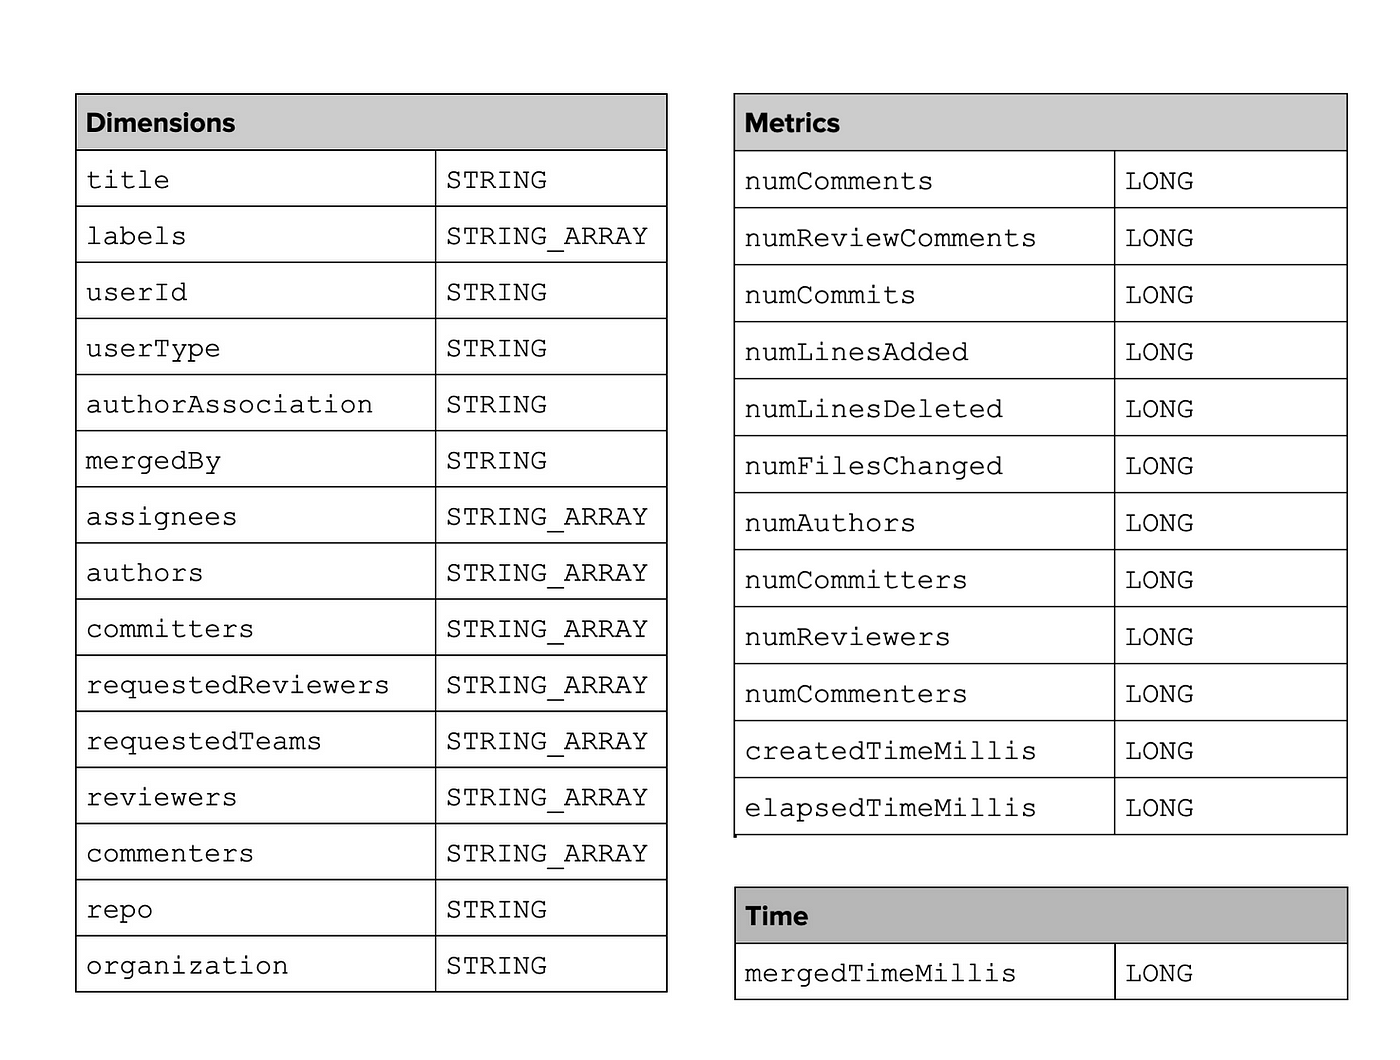
GitHub Event Schema for Apache Pinot

Querying GitHub Events with Apache Pinot

Now that we have our schema and table created, Pinot is able to ingest GitHub events from Kafka so that we can query it as a data structure using PQL. Earlier we reviewed the easiest way to query Pinot from a web browser, using the Pinot Data Explorer. Pinot has a SQL-based query language called PQL (Pinot Query Language), which is a declarative query language that gives you a familiar way to interface with data. It’s important to mention that PQL is based on SQL, and shares much of its semantics, but is not intended to be used for database transactions or writes.

After firing up the Pinot Data Explorer, you’ll be able to run a PQL query to fetch data from the GitHub events that are being ingested in realtime.

0*JrCX2akz6jDaQk5w

Query GitHub Event Schema in Pinot Data Explorer

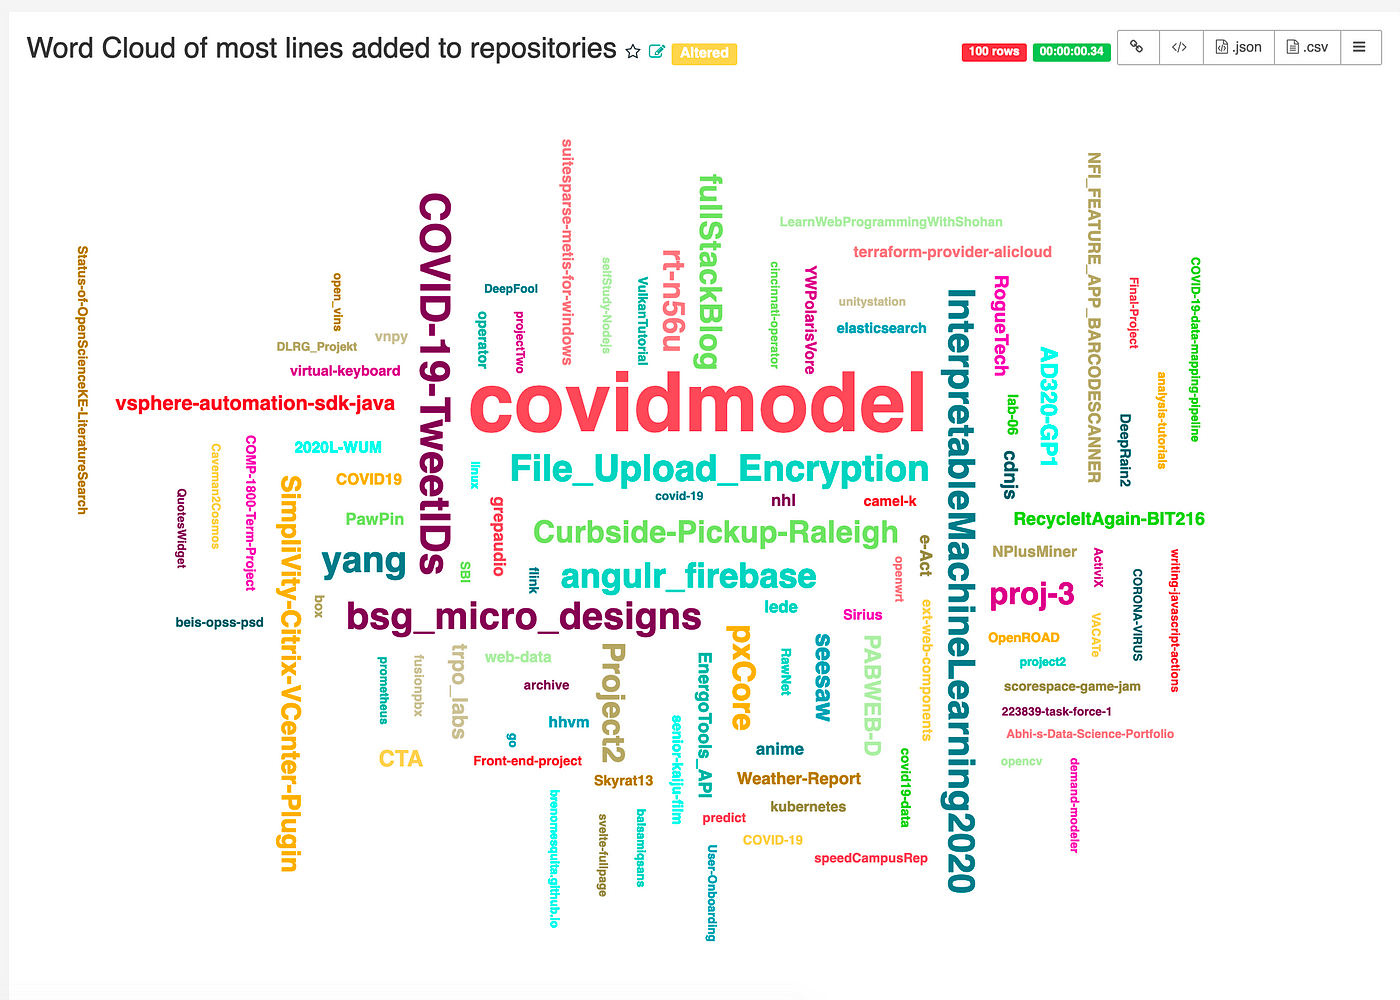
From here, there are many different ways to interface and visualize the real-time event data from GitHub. One such way is to create a chart using Apache Superset, which is a popular open source web-based business intelligence tool. This is a common tool used to create reports that visualize Pinot data queried with PQL.

0*B8zBeHHAy CHTldf

Querying GitHub Event Data from Pinot in Superset

You can find more details and instructions on using Superset with Pinot from this community blog post.

Conclusion

In this tutorial we introduced you to using Kafka and Pinot to analyze, query, and visualize event streams ingested from GitHub. Please visit our documentation for the comprehensive step-by-step tutorial referenced in this blog post.

If you’re interested in learning more about Pinot, become a member of our open source community by joining our Slack channel and subscribing to our mailing list.

We’re excited to see how developers and companies are using Apache Pinot to build highly-scalable analytical queries on real-time event data. Feel free to ping us on Twitter or Slack with your stories and feedback.

Finally, here is a list of resources that you might find useful as you start your journey with Apache Pinot.

Special thanks

A very special thanks to Neha Pawar and the Apache Pinot engineering team for co-authoring this blog post. If you’re interested in co-authoring or contributing an article to our developer blog, please reach out to @kennybastani on Twitter.

Using Apache Spark and Neo4j for Big Data Graph Analytics

Monday, November 3, 2014

As engineers, when we think about how to solve big data problems, evaluating technologies becomes a choice between scalable and not scalable. Ideally we choose the technologies that can scale to a variety of business problems without hitting a ceiling down the road.

Database technologies have evolved to be able to store big data, but are largely inflexible. The data models require tedious transformations and shuffling around of data. This is a complex process that is compounded in its complexity by combining a variety of inflexible solutions and platforms.

Fast and scalable analysis of big data has become a critical competitive advantage for companies. There are open source tools like Apache Hadoop and Apache Spark that are providing opportunities for companies to solve these big data problems in a scalable way. Platforms like these have become the foundation of the big data analysis movement.

Still, where does all that data come from? Where does it go when the analysis is done?

Building a Neo4j Reporting Service Part II

Wednesday, April 30, 2014


It is a capital mistake to theorize before one has data. Insensibly one begins to twist facts to suit theories, instead of theories to suit facts.

Sir Arthur Conan Doyle, Author of Sherlock Holmes stories
A Subgraph From Neo4j's Browser
Just as Sir Arthur Conan Doyle's character, Sherlock Holmes, manically collects facts and evidence to prove theories, we find ourselves doing much of the same today except on a much larger scale web scale. The web is an ever growing expanse of facts and evidence. It is at our disposal to observe without much of a challenge, but to store it and retrieve it in a way that answers the big questions, that's challenging.

Continuing on from Building a Graph-based Reporting Platform: Part I, I posed some questions related to understanding how to build great community experiences around Neo4j using Meetup.com for local events. I presented an idea to use Neo4j to build a platform that could help us understand the demand for presenting compelling content at events.

Compelling content is at the core of great community experiences. That content fuels the conversations between people, ideas begin to flow, and innovation is born.

My idea was to build an open-source platform that would poll public APIs, translate collected data into a graph, and store it in a graph database to be analyzed, queried, and visualized over time. The first component of this architecture is the Data Import Scheduler, which this post describes in detail.

Polling Data From Public APIs

Let's start out by answering a basic question.

What does the data import scheduler do?
The analytics data import scheduler is a Node.js process that can be hosted for free on Heroku and is responsible for collecting time-based statistics from a public API. In this case, the Meetup.com REST API exposes a set of methods that provide a momentary snapshot into the number of members that a group has at the time of the request. The data import scheduler polls this endpoint once a day to retrieve Meetup group statistics to later be used for time-based analysis from our graph database, Neo4j.

As illustrated in the diagram below, the Node.js application wakes up once a day and checks in with the Meetup.com REST API.


The scheduler process polls Meetup.com's REST API daily. An HTTP GET request is dispatched for each city we're tracking, returning a JSON formatted response for groups in those cities. The JSON data for each group is then translated into a subgraph, formatted as Neo4j's Cypher query language. The Cypher query is then sent as a transaction to Neo4j and updates a snapshot of the group's stats for that day.

Importing a Meetup Group's Subgraph

The image below is a visualization of a Meetup group's subgraph, translated from JSON data polled on an arbitrary date.

Graph Database - San Francisco on 4/28/2014

We see that the group has a set of topic nodes, which may already exist within the database. The subgraph must be merged into the larger graph without duplicating any nodes. Using Cypher's MERGE clause we can get or create nodes, which is useful for expanding our graph's connected data. Each topic will collect more groups as new subgraphs are merged for daily imports. The same is also true for both day and location nodes.

After a few days of scheduled imports, a group's subgraph begins to take shape. As day nodes are connected to the previous day's node, membership statistics are connected.

Neo4j Data Import Model
A Meetup Group Statistics Subgraph, 4/23 to 4/28

The data import scheduler application is open-source and available on GitHub. Also, full documentation is available to help you get started with customizing your own graph-based reporting platform.

All analysis on the temporal stats collected from the data import scheduler is performed within the REST API module of the reporting platform. It also safely exposes the graph database to a front-end web dashboard, consumed from client-side JavaScript. The REST API uses Swagger, which is a specification and complete framework for describing, producing, consuming, and visualizing RESTful web services.

Building a Neo4j Reporting Service Part I

Thursday, April 24, 2014

Data science is pretty hot right now. The obvious reason is that data is rapidly expanding in complexity and size. There is an opportunity to be had in building systems that can capture this data, classify it in multiple dimensions, and to scale it up to the demands of analysts looking to convert data into valuable reports.


As a developer evangelist for Neo4j, I am frequently out in the community talking about things I build using our database. We use Meetup.com to schedule and promote our community events all over the world.

If you're unfamiliar with Meetup.com, here is a description from their Wikipedia entry:

"Meetup is an online social networking portal that facilitates offline group meetings in various localities around the world. Meetup allows members to find and join groups unified by a common interest, such as politics, books, games, movies, health, pets, careers or hobbies. Users enter their postal code or their city and the topic they want to meet about, and the website helps them arrange a place and time to meet. Topic listings are also available for users who only enter a location."

At Neo4j, we're obsessed with data, especially connected data. We believe in our product because we use it to solve our own problems every day. With something like Meetup.com, we found ourselves guessing about many of the aspects of our community and how we could do a better job creating a great community experience.

Some of those questions were:
  • How many people will show up to an event from the attendee list?
  • What kind of content are people interested in hearing about?
  • What's the best location to host our meetups to boost attendance?

I wanted to use Neo4j to do reporting. I decided to put together a platform to track some of this information and build some reports to visualize the data we collected. I started by breaking down the problem into a set of stories to be implemented as a report.

Problem

  • Track meetup group growth over time
  • Apply tags to meetup groups and report combined growth of all groups over time

Questions

  • Given a start date and an end date, what is the time series that plots the membership growth of a given meetup group?
  • Given a start date, an end date, and a combination of tags, what is the time series that plots the combined membership growth of all meetup groups with those tags?
  • How do you generate the JSON data of a time series for a basic JS line chart plugin?

I decided to start with a GraphGist, which is an open source project we built to enable our community to put together a quick proof of concept using our database.

Neo4j for Graph Analytics: Meetup.com Example

I designed an example graph data model, which I then translated into Neo4j's Cypher query language to create an example dataset.


Now it was time to scale it up to a full platform. I decided to use Node.js.


There would be three Node.js driven components. One console application for importing data on a schedule and two web applications; a dashboard for displaying reports and REST API to communicate with the Neo4j graph database.


With an architecture in place, I went forward with building out each of the modules.

In my next blog post I will go through the details of building the import scheduler, which polls the Meetup.com API each day and imports the graph data model into Neo4j.

Feel free to take a look at the finished documentation which details the creation of each of the Node.js modules:

Graph-based Reporting Documentation

Also, I put a slide deck together: