As a developer evangelist for Neo4j, I am frequently out in the community talking about things I build using our database. We use Meetup.com to schedule and promote our community events all over the world.
If you're unfamiliar with Meetup.com, here is a description from their Wikipedia entry:
"Meetup is an online social networking portal that facilitates offline group meetings in various localities around the world. Meetup allows members to find and join groups unified by a common interest, such as politics, books, games, movies, health, pets, careers or hobbies. Users enter their postal code or their city and the topic they want to meet about, and the website helps them arrange a place and time to meet. Topic listings are also available for users who only enter a location."
At Neo4j, we're obsessed with data, especially connected data. We believe in our product because we use it to solve our own problems every day. With something like Meetup.com, we found ourselves guessing about many of the aspects of our community and how we could do a better job creating a great community experience.
Some of those questions were:
How many people will show up to an event from the attendee list?
What kind of content are people interested in hearing about?
What's the best location to host our meetups to boost attendance?
I wanted to use Neo4j to do reporting. I decided to put together a platform to track some of this information and build some reports to visualize the data we collected. I started by breaking down the problem into a set of stories to be implemented as a report.
Problem
-
Track meetup group growth over time
-
Apply tags to meetup groups and report combined growth of all groups over time
Questions
-
Given a start date and an end date, what is the time series that plots the membership growth of a given meetup group?
-
Given a start date, an end date, and a combination of tags, what is
the time series that plots the combined membership growth of all meetup
groups with those tags?
-
How do you generate the JSON data of a time series for a basic JS line chart plugin?
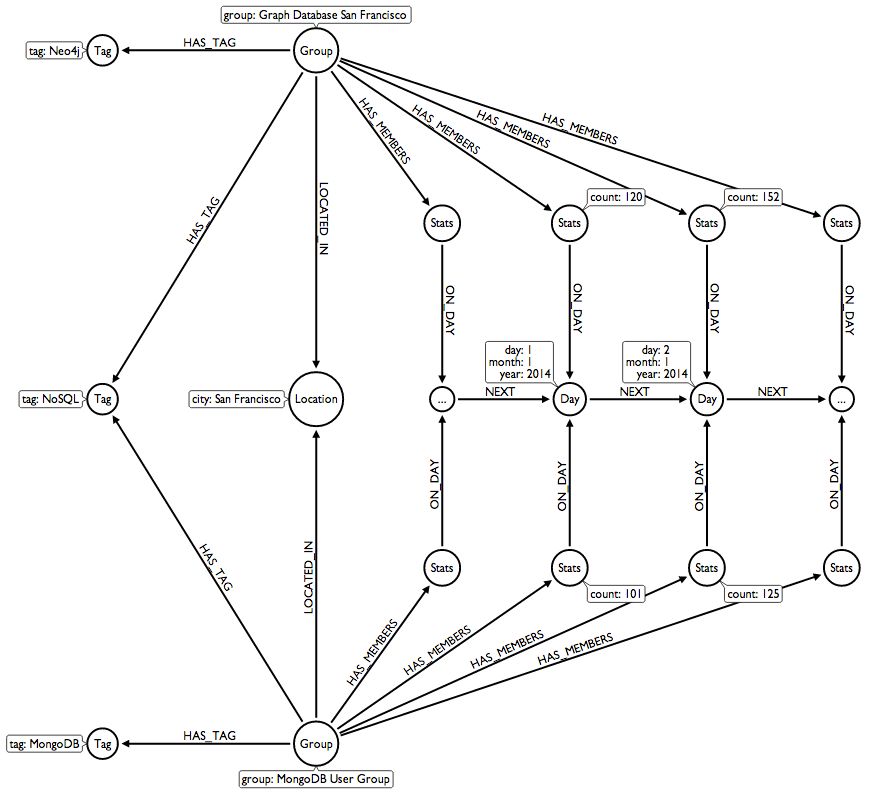
I decided to start with a GraphGist, which is an open source project we built to enable our community to put together a quick proof of concept using our database.
Neo4j for Graph Analytics: Meetup.com Example
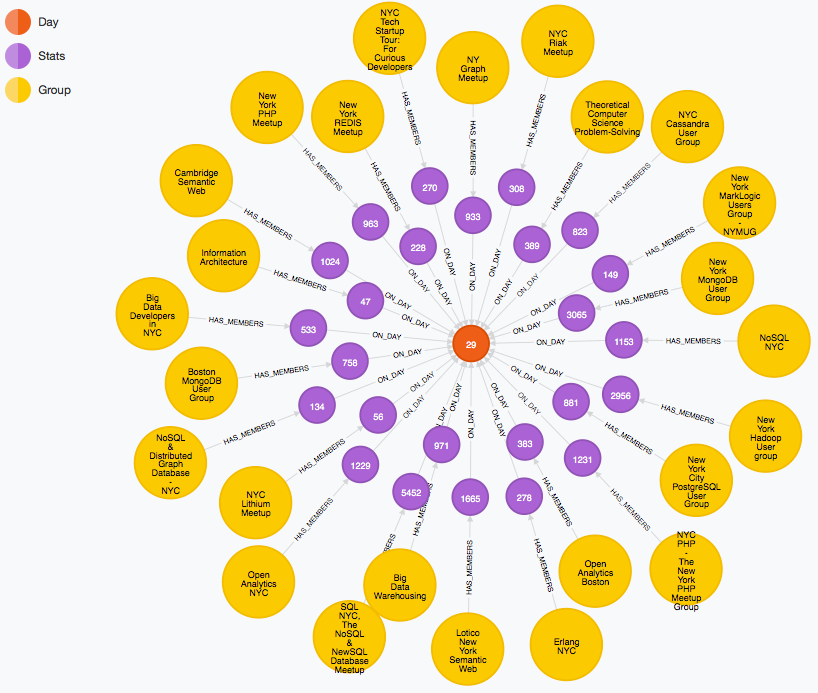
I designed an example graph data model, which I then translated into Neo4j's Cypher query language to create an example dataset.
Now it was time to scale it up to a full platform. I decided to use Node.js.
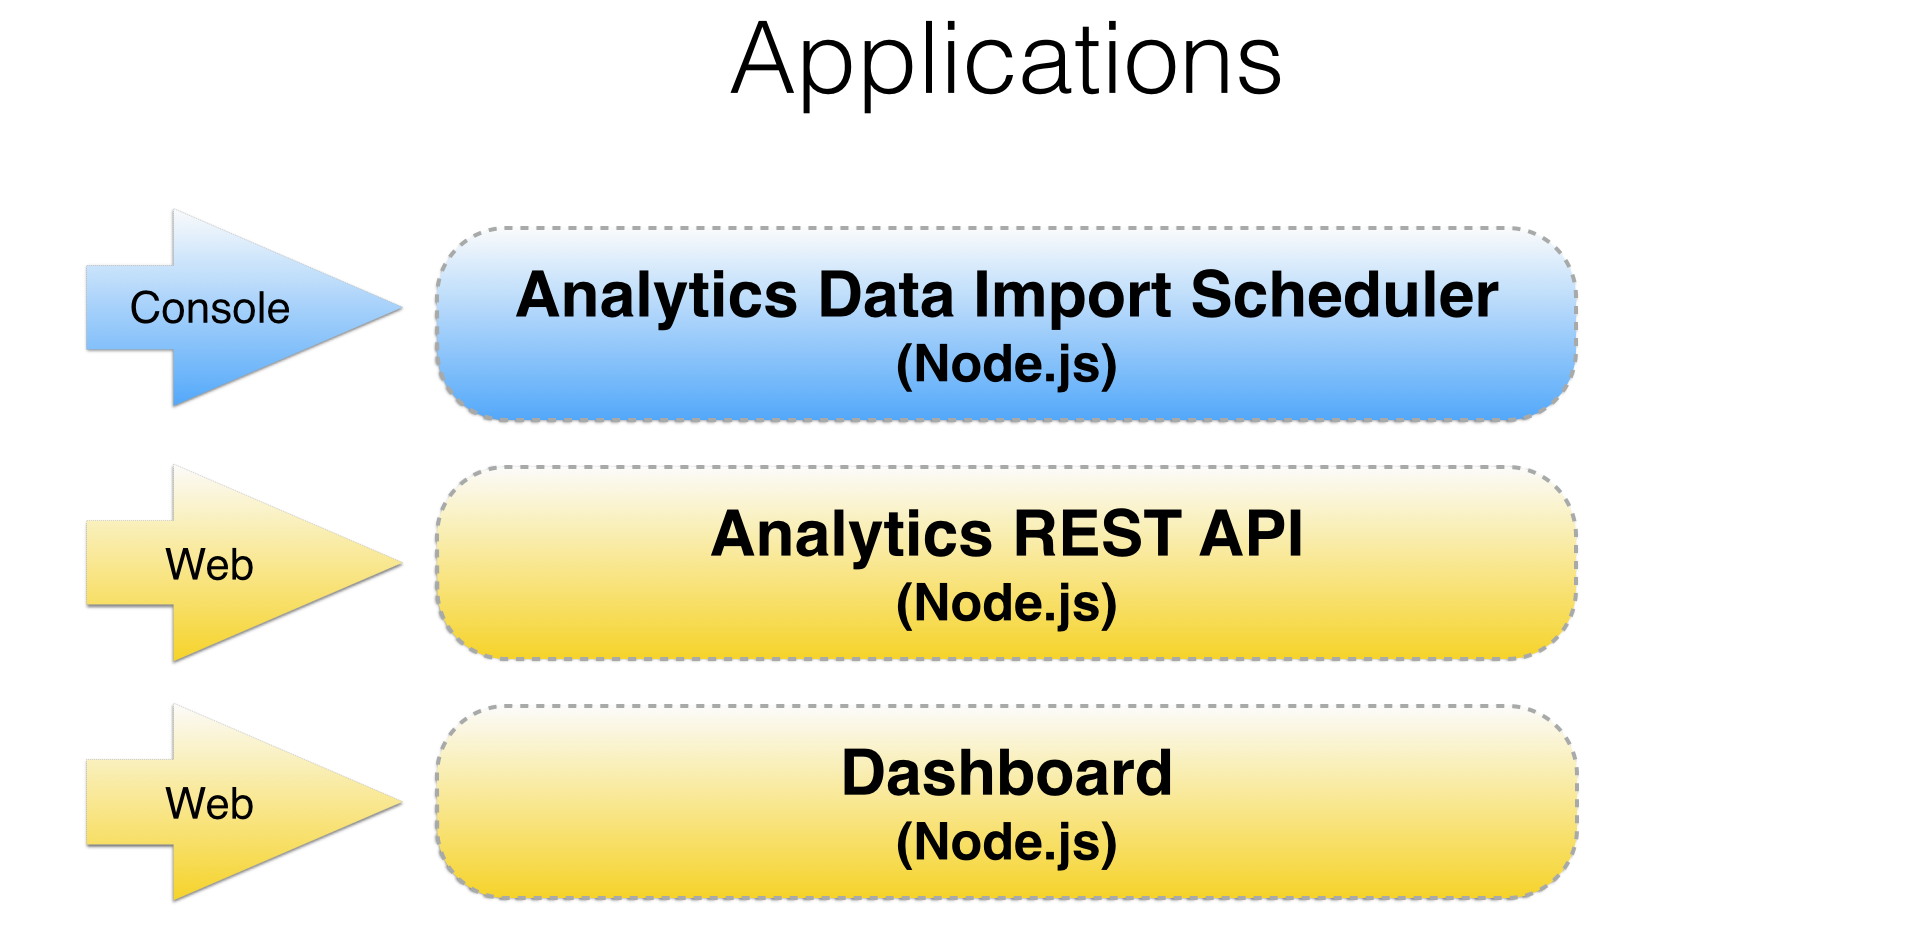
There would be three Node.js driven components. One console application for importing data on a schedule and two web applications; a dashboard for displaying reports and REST API to communicate with the Neo4j graph database.
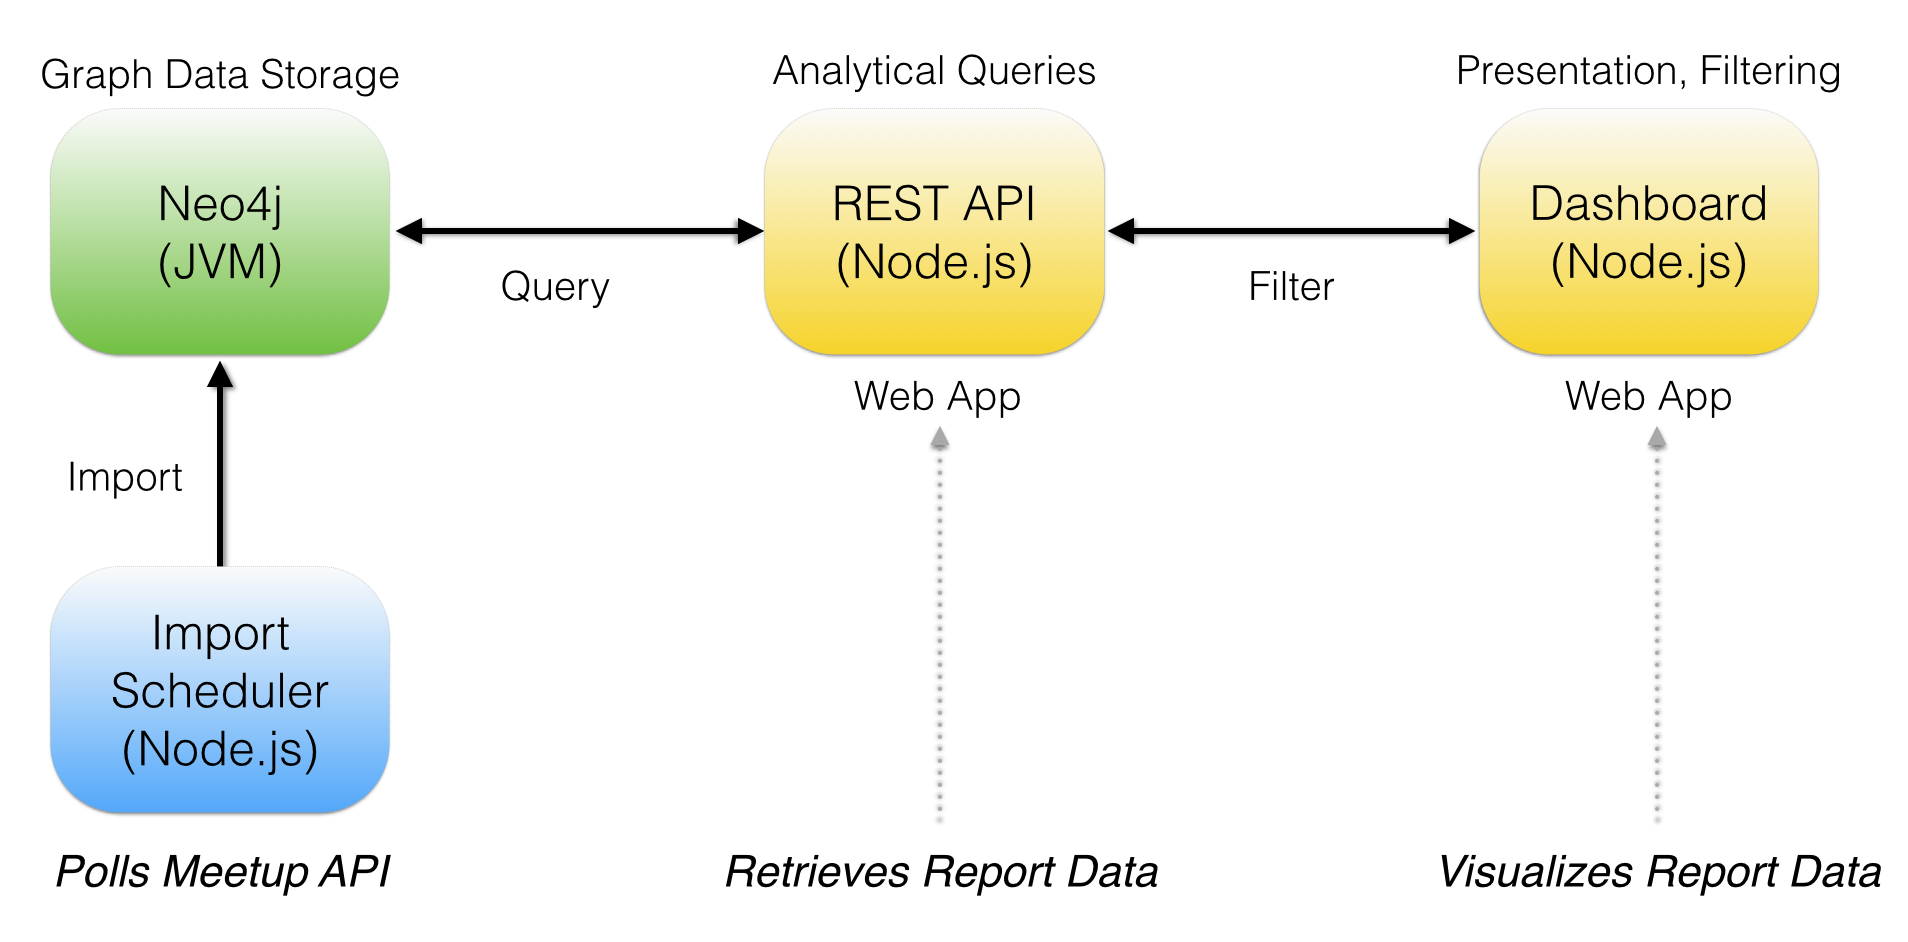
With an architecture in place, I went forward with building out each of the modules.
In my next blog post I will go through the details of building the import scheduler, which polls the Meetup.com API each day and imports the graph data model into Neo4j.
Feel free to take a look at the finished documentation which details the creation of each of the Node.js modules:
Graph-based Reporting Documentation
Also, I put a slide deck together:


