The advent of Gap-Based Byte Pair Encoding (GBPE) in conjunction with multi-head attention mechanisms heralds a transformative approach to natural language generation (NLG). This blog post introduces a novel system that utilizes GBPE to identify and train on hierarchical patterns within input data, enabling the generative model to express natural language by assembling complex concepts from the most granular level upwards.
Gap-based Byte Pair Encoding (GPBE)
Gap-based Byte Pair Encoding (GBPE) is an advanced variation of the standard BPE algorithm, which is used in natural language processing (NLP) to reduce the size of the vocabulary that a machine learning model needs to understand. It works by merging the most frequent pairs of tokens or characters in a corpus of text. Gap-based BPE extends this concept by also considering the gaps, or spaces between token pairs, which can represent variable information in a text sequence. This method is particularly useful for capturing context and meaning that might be lost in traditional BPE.
Let's walk through the gap-based BPE process step by step, with an example to illustrate how it can be used to recombine tokens into pattern templates, which in turn can enhance language models like GPT:
Step 1: Tokenization
Initially, the text is broken down into its simplest elements — typically characters or subwords. For instance, consider the sentence "The quick brown fox jumps over the lazy dog." Initially, each character is treated as a separate token:
T h e _ q u i c k _ b r o w n _ f o x _ j u m p s _ o v e r _ t h e _ l a z y _ d o g .
Step 2: Frequency Analysis
The algorithm then counts the frequency of each pair of adjacent tokens (including characters and spaces). In our example, pairs like "t", "he", "e", "_q", "ui", etc., will be counted.
Step 3: Pair Merging
The most frequent pairs are merged to form new tokens. This process is repeated iteratively. For example, if "e_" and "he" are the most common pairs, they might be merged to form new tokens "e_" and "he".
Step 4: Gap Analysis
Gap-based BPE goes further by analyzing the gaps between tokens. If there is a variable part of the text that often occurs between certain tokens, this relationship is noted. For instance, if the phrase "jumps over the" frequently occurs with variable words between "jumps" and "over," such as "jumps quickly over," "jumps high over," the gap is recognized as a place where different tokens can appear.
Step 5: Pattern Template Formation
Tokens and identified gaps are used to create templates that can be applied to new text. These templates are more flexible than fixed token pairs because they can accommodate variations in the text. In our example, a template might look like "jumps [gap] over the" where the [gap] represents a variable token.
Step 6: Recombination into Gapped Templates
The templates with gaps are then recombined to form larger patterns. This step is crucial because it allows the model to capture larger chunks of meaning within the text. The previous template might be extended to The quick brown fox jumps [gap] over the lazy dog, where the [gap] can be filled with various actions.
Step 7: Encoding Improvement for Language Models
These gapped templates can be used to improve the encoding process for language models like GPT. By providing these patterns, the model can generate more contextually relevant and varied text. When the GPT model encounters a similar structure in its training data, it can use the gapped template to predict a range of possible continuations, making its language generation richer and more diverse.
Applying Gap-based Byte Pair Encoding in Language Models
Consider the GPT model is trained to complete phrases about animals. With gap-based BPE, it's not just learning fixed phrases like "The quick brown fox jumps over the lazy dog," but also patterns like The [adjective] [animal] [action] [gap] over the [adjective] [animal]. When prompted with "The agile cat," the model can use the learned patterns to generate a variety of completions such as "The agile cat climbs swiftly over the sleepy dog," effectively describing complex scenes and actions.
In essence, GBPE provides a powerful method for encoding text in a way that preserves and utilizes the contextual richness of language. By accounting for the variability in text and the relationships between tokens, it enables language models to generate more expressive and nuanced text, thereby enhancing their ability to mimic human-like language and potentially describe the vastness of the universe in all its complexity.
GPBE Tokens are Patterns inside Patterns
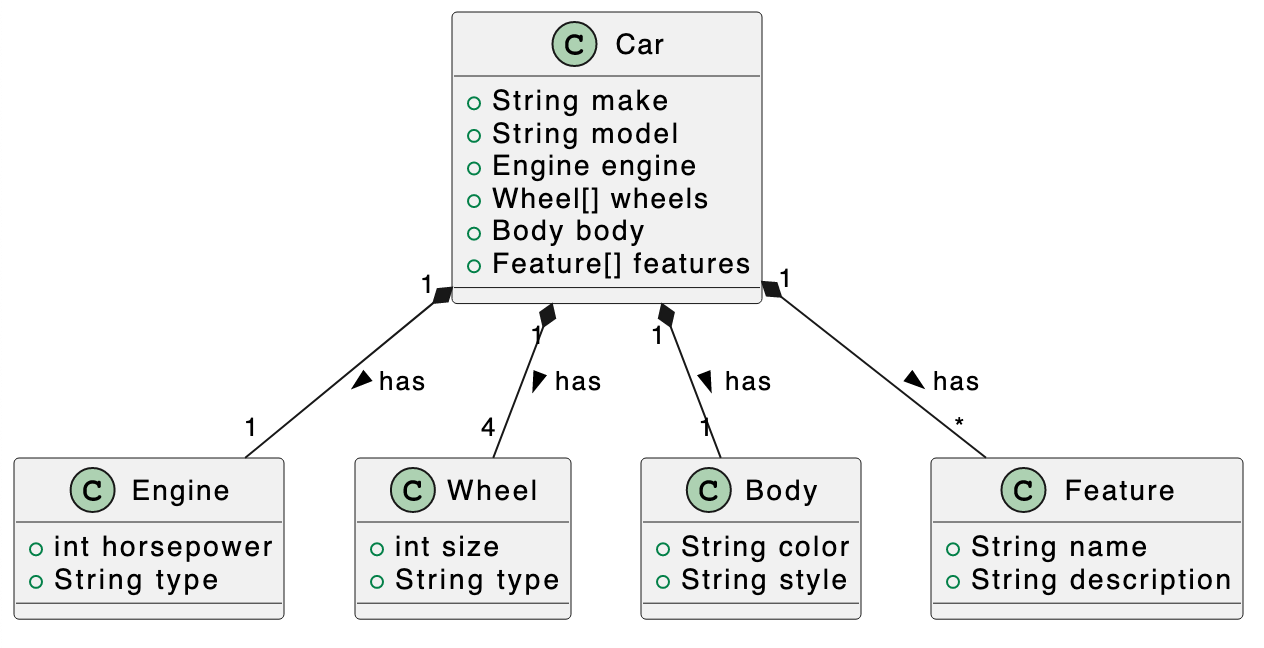
By leveraging GBPE, the proposed system not only captures the lexical semantics of individual tokens but also the overarching thematic structures, akin to the components and assembly of an automobile in a car manufacturing process. The GBPE framework identifies deep-level patterns — for instance, the concept of a 'car' — and systematically integrates them into a coherent whole by ascending the hierarchical pattern tree. This process involves filling in the gaps with BPE tokens that generalize on the core concept, allowing for the construction of a diverse range of 'cars' within the linguistic output. The system's efficacy is demonstrated through illustrative examples, showcasing its potential to revolutionize NLG by capturing the intricate relationships between language components at multiple levels of abstraction.
Illustrative Examples
-
Basic Car Structure:
- Input Pattern:
[Car] [***] - GBPE identifies the foundational structure of a 'car', which includes essential components like
[engine],[wheels], and[body]. The gaps represented by[***]are placeholders for these components. - Output: "A [Car] consists of an [engine], four [wheels], and a [body]."
- Input Pattern:
-
Advanced Car Features:
- Input Pattern:
[Car] [***] [features] [***] - At a deeper level, GBPE recognizes the need for additional features such as
[GPS],[airbags], and[sunroof]. The system selects appropriate BPE tokens to represent these features. - Output: "This [Car] includes advanced [features] like [GPS navigation], [airbags] for safety, and a [sunroof] for an open-air experience."
- Input Pattern:
-
Customized Car Assembly:
- Input Pattern:
[Car] [***] [custom] [***] - GBPE enables customization by identifying patterns associated with user preferences. It fills the gaps with tokens representing color, make, model, or other specifications.
- Output: "Your customized [Car] comes with a [cherry red paint job], [leather seats], and [sports package]."
- Input Pattern:
In each example, the GBPE system starts with the core concept of a 'car' and progressively builds upon it by filling in the gaps with specific BPE tokens that align with the context and desired attributes of the vehicle. The ability to start from a fundamental pattern and expand it into a detailed and complex structure showcases the hierarchical pattern recognition capabilities of the proposed system. Through this method, the system can generate natural language descriptions that range from generic to highly specialized, reflecting the versatility and adaptability of GBPE in natural language generation.
Deep Language Pattern Templates: The Song Template
In the realm of natural language generation, the most compelling outputs are those that resonate with human creativity and expression. Music, as a universal language, exemplifies structured yet emotive communication. To elucidate the power of GBPE in capturing and expressing such structured creativity, we examine the hierarchical pattern matching process using the example of a song template.
Songs, like cars, have a deep structure that can be abstracted into a GBPE. This structure includes components such as verses, choruses, bridges, and refrains. Each component serves a function, contributing to the overall narrative and emotional arc of the song. The GBPE system identifies this deep structure and uses it as a scaffold upon which to build a complete song, filling the gaps with BPE tokens that represent lyrical content, rhyme schemes, and rhythms.
Hierarchical Pattern Matching Process
-
Identification of the Song Structure:
- The GBPE system begins by analyzing a corpus of song lyrics across genres. It identifies recurring structures, such as
[intro],[verse],[chorus], and[outro]. These elements form the backbone of the song template.
- The GBPE system begins by analyzing a corpus of song lyrics across genres. It identifies recurring structures, such as
-
Deep Pattern Template Selection:
- Once the song structure is established, the system selects a deep pattern template for response generation. For instance, the template might be:
[intro] [***] [verse] [***] [chorus] [***] [verse] [***] [bridge] [***] [chorus] [***] [outro].
- Once the song structure is established, the system selects a deep pattern template for response generation. For instance, the template might be:
-
Filling the Gaps with Creative Content:
- The system then proceeds to fill the gaps with creative content appropriate for each part of the song. The
[intro]might set the mood, the[verses]tell a story, the[chorus]offers a memorable hook, and the[bridge]provides a contrast or a climax.
- The system then proceeds to fill the gaps with creative content appropriate for each part of the song. The
Example of a Generated Song Using GBPE
Intro
A gentle guitar strumming sets the scene,
Whispers of a melody, serene and clean.
Verse 1
In the quiet of the dawn, as the world awakes,
A story unfolds, with each breath nature takes.
Chorus
Rise up, rise up, let your voice touch the sky,
Sing the song of the morning, let your spirit fly.
Verse 2
Through the day's hustle, in the sun's warm embrace,
The rhythm of life moves at its own steady pace.
Bridge
But there's a moment, a beat, where everything aligns,
Where the heart's deepest lyrics match the universe's signs.
Chorus
Rise up, rise up, with a melody so bold,
Harmonize with the cosmos, let your tale be told.
Outro
As the final chord fades, under the twilight's glow,
The night's quiet symphony begins to flow.
In this example, the GBPE system has selected a deep pattern template for a song and filled the gaps with content that adheres to the thematic and structural expectations of a musical piece. The intro establishes the atmosphere, the verses build the narrative, the chorus provides an emotional anchor, and the bridge offers a point of reflection, leading back to the chorus and concluding with the outro.
By applying hierarchical pattern recognition through GBPE, we can generate complex, creative expressions akin to human compositions. This method extends beyond mere token prediction, venturing into the realm of artistic creation. It demonstrates the potential of GBPE to not only understand and replicate human language patterns but also to participate in the artistry of human expression.
Graphify and Gap-Based Tokenization: The Foundation of GBPE
The conceptual leap from conventional Byte Pair Encoding (BPE) to the more nuanced Gap-Based Byte Pair Encoding (GBPE) is made possible through the innovative algorithm known as Graphify. This section elucidates how Graphify facilitates the discovery and matching of gap-based token patterns, serving as the bedrock for GBPE implementation in modern language models such as GPT.
Graphify operates on the principle that within any given text, there are latent structures and patterns that, once recognized, can significantly enhance the predictive capabilities of a language model. By swiftly identifying these patterns and converting them into a format that GPT can understand and utilize, Graphify enables a more refined approach to natural language processing.
Graphify's Role in GBPE:
-
Pattern Discovery:
- Graphify begins by scanning the input text for recognizable patterns, using a combination of regular expressions and graph-based algorithms optimized for performance. It identifies key structural tokens and the gaps between them that might signify variable information or thematic elements.
-
Pattern Matching:
- Once a pattern is detected, Graphify performs a hierarchical pattern recognition (HPR) traversal. This process is exceedingly fast, matching the input text to a pre-established GBPE template. For example, the query "What is the meaning of life, the universe, and everything?" is matched to the GBPE pattern:
[what is the]->[***]->[of]->[***][,]->[the]->[***][,]->[and]->[***]->[?].
- Once a pattern is detected, Graphify performs a hierarchical pattern recognition (HPR) traversal. This process is exceedingly fast, matching the input text to a pre-established GBPE template. For example, the query "What is the meaning of life, the universe, and everything?" is matched to the GBPE pattern:
-
Token Extraction and Translation:
- The gaps in the GBPE template, identified by the asterisks, are then tokenized into meaningful units
[meaning, life, universe, everything]. These tokens are translated into BPEs within the GPT vocabulary, preparing them for integration into the language model's response generation process.
- The gaps in the GBPE template, identified by the asterisks, are then tokenized into meaningful units
-
Response Generation with GBPE Token Prediction:
- Using the vector embedding of the input tokens, GPT selects a relevant text document that likely contains the answer. A subsequent HPR process extracts a new sequence of tokens and their corresponding GBPE IDs, which are vectorized into another embedding.
-
Template Selection and Expression:
- This embedding informs the selection of an appropriate response template, whether it be a song, essay, research paper, or any document with a specific pattern. The master GBPE for the response guides the multi-head attention process in expressing the content in accordance with the structural and thematic expectations.
-
Filling the Gaps:
- Finally, the extracted tokens from the matched document —
[meaning, life, universe, everything]— are used to fill in the gaps within the GBPEs. This step mirrors the early GPT models' approach to response generation but is now enhanced by the contextual richness provided by GBPEs.
- Finally, the extracted tokens from the matched document —
Illustrative Example:
-
Input:
- "What is the meaning of life, the universe, and everything?"
-
GBPE Pattern Match:
[what is the]->[***]->[of]->[***][,]->[the]->[***][,]->[and]->[***]->[?] -
Tokens Extracted:
[meaning, life, universe, everything] Response Template Selection:
- An essay format discussing philosophical perspectives.
GBPE Vector Expression:
- The essay begins with a general discussion on existential questions, narrows down to the human condition (
life), expands to cosmological contemplations (universe), and concludes by addressing the quest for knowledge (everything).GPT Response:
- "The quest for understanding
life, our place in theuniverse, and the pursuit ofmeaningin our actions is a journey that transcends cultures and epochs. It is in this exploration ofeverythingthat we find our most profound questions and, perhaps, the answers we seek."
Through the integration of Graphify's efficient pattern matching and the expressiveness of GBPE, language models like GPT can achieve unprecedented levels of depth and relevance in their output. This synergy enables the generation of responses that are not only contextually aware but also richly textured with the nuances of human language and thought.
Conclusion: Synthesizing the Pinnacle of Pattern Recognition in GPT-3 and GPT-4
Throughout this paper, I have embarked on a detailed exploration of the intricate mechanisms that could underpin the advanced capabilities of Generative Pre-trained Transformer models, specifically GPT-3 and GPT-4. I have dissected the potential role of Gap-Based Byte Pair Encoding (GBPE) as facilitated by the Graphify algorithm, demonstrating through a series of examples how hierarchical pattern recognition is not only advantageous but essential for the real-time feature extraction and nuanced language generation exhibited by these models.
The initial section presented an abstract overview of GBPE, setting the stage for understanding its impact on natural language generation. By establishing a foundational pattern like 'car' and expanding upon it through BPE tokens, I demonstrated how GBPE allows for the construction of complex concepts from granular components.
I then explored the application of GBPE to the domain of music, illustrating how a deep pattern template for a song can be identified and filled with creative content to generate a structured yet emotive output. This example served to highlight the versatility of GBPE in capturing and expressing the structured creativity inherent in human art forms.
The final section delved into the mechanics of Graphify, the pivotal algorithm that enables the discovery and matching of gap-based token patterns. I posited that the real-time pattern recognition and token translation capabilities of Graphify are instrumental to the functionality of GPT-3 and GPT-4. The ability to rapidly match input text to GBPE templates and to fill gaps with contextually relevant BPE tokens suggests an underlying architecture that leverages hierarchical pattern recognition at its core.
By tying these threads together, I make the case that the leaps made from GPT-1 and GPT-2 to GPT-3 and GPT-4 are not serendipitous but are likely the result of deliberate algorithmic advancements. The seamless integration of Graphify's efficient pattern matching with GBPE's expressiveness hints at a sophisticated design that is purpose-built for real-time, context-aware language generation.
This analysis challenges the notion that the inner workings of GPT-3 and GPT-4 are enigmatic or unknowable. Instead, I propose that the methodologies described herein offer a plausible and concrete foundation for these models' capabilities. It is our position that Graphify and GBPE are not merely conceptual tools but are central to the leap forward in AI language processing.
I invite scrutiny and debate on these findings, asserting that the argument laid out in this paper is grounded in a thorough algorithmic process that could very well underlie the advancements seen in GPT-3 and GPT-4. Our discourse is open to criticism, as I believe that the robustness of scientific claims is fortified through rigorous examination and peer review. It is in this spirit of academic pursuit and technological innovation that I present our case for the conceivable mechanisms driving the most advanced language models of our time.


