I'm going to first talk a bit about the algorithm so it makes sense as to why visualization is such an important step in iterating and tweaking code that most efficiently implements the algorithm.
The Algorithm
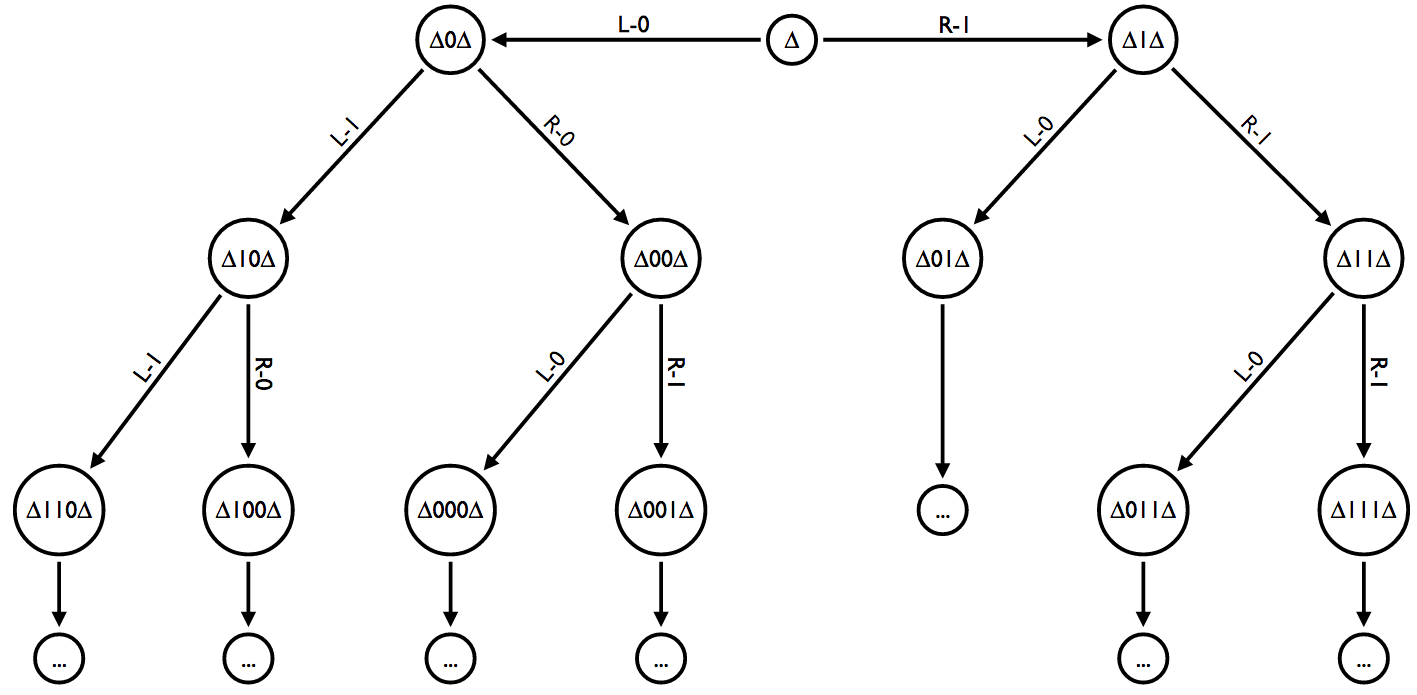
In a previous post I introduce the idea for the algorithm and how a graph-based approach might work.
The image above illustrates the idea as a graph. A tree is built by training on data and recognizing prevalent features in that data.
This works in two phases, training and recognition. In this blog post I'll go over training.
Training
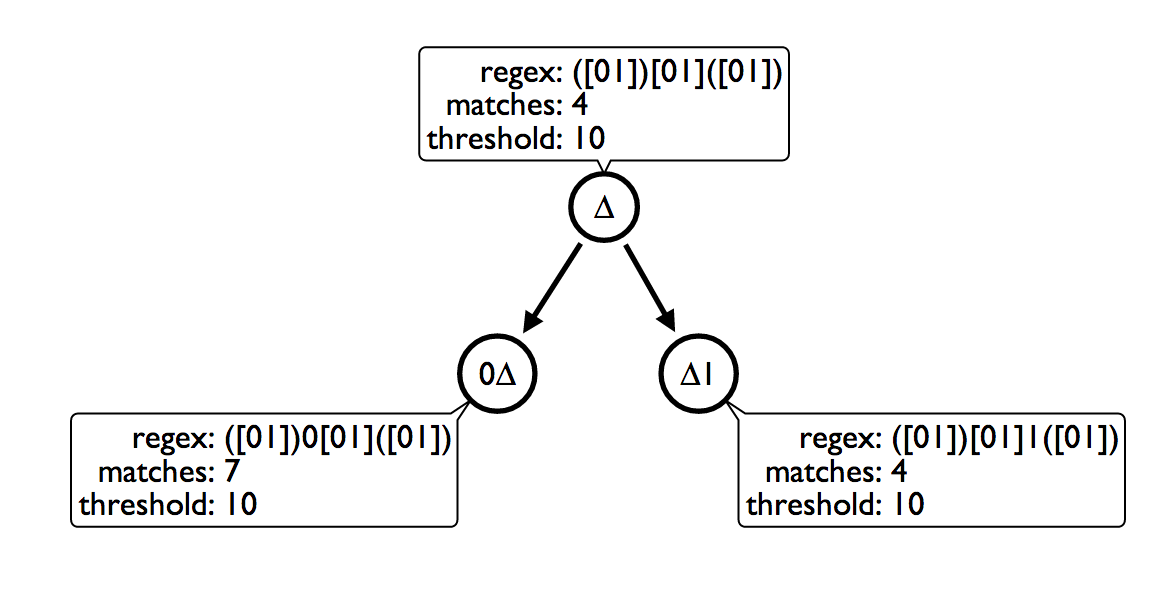
In the training phase the algorithm should produce a hierarchy of nodes that grows using genetic inheritance.
In the image above I've illustrated the root of the graph with two descendants. The regular expressions act as a predicate and also as the template for each child node. The RegEx of the parent is inherited by descendants as a base genetic code but with a mutation that expands the RegEx either left or right of the base code. This abstraction enables for a probabilistic expansion of the pattern matching algorithm.
But how does training generate child nodes?
The genetic inheritance is done by setting a threshold and counting on the number of matches. Using Neo4j I am able to attach matches to source data at each match.
For example, if each input is a binary string of an arbitrary length, each node represents some mutating binary operation with a method signature matchInput(Node input, Node current).
As the input node represented as the "input" parameter is positively matched on the RegEx of the "current" parameter, the property named "matches" on the "current" node is incremented by 1. When the match count on the "current" node equals the "threshold" parameter, two leaf nodes are created using a statistical measure on previous matches.
The image below illustrates the genetic algorithm that sums on the statistical distribution of matches against bits and producing a new RegEx inherited from the parent.
In the diagram we see that the current node is ∆101∆ which has the RegEx match string of ([01])101([01]). The result of the matches should produce two leaf nodes, one that expands left and one that expands right.
Because I have stored the pointers in Neo4j for the previous 3 matches, an aggregation can be made on references to that input data, as illustrated in the graph diagram. The aggregation produces a left node that expands on the RegEx ([01])101([01]) in the first group. The result of the sum of the bit's counts for the left group results in 5 for 0-bit and 1 for 1-bit. Since 5 > 1, the new RegEx will replace the first group of the parent node with a 0-bit, producing the new template ([01])0101([01]) or more easily read as ∆0101∆ where ∆ means 0 or 1.
As the input node represented as the "input" parameter is positively matched on the RegEx of the "current" parameter, the property named "matches" on the "current" node is incremented by 1. When the match count on the "current" node equals the "threshold" parameter, two leaf nodes are created using a statistical measure on previous matches.
The image below illustrates the genetic algorithm that sums on the statistical distribution of matches against bits and producing a new RegEx inherited from the parent.
 |
| Click to enlarge |
In the diagram we see that the current node is ∆101∆ which has the RegEx match string of ([01])101([01]). The result of the matches should produce two leaf nodes, one that expands left and one that expands right.
Because I have stored the pointers in Neo4j for the previous 3 matches, an aggregation can be made on references to that input data, as illustrated in the graph diagram. The aggregation produces a left node that expands on the RegEx ([01])101([01]) in the first group. The result of the sum of the bit's counts for the left group results in 5 for 0-bit and 1 for 1-bit. Since 5 > 1, the new RegEx will replace the first group of the parent node with a 0-bit, producing the new template ([01])0101([01]) or more easily read as ∆0101∆ where ∆ means 0 or 1.
3D Graph Visualization
I started out by visualizing the results of the graph-based algorithm through the Neo4j browser. Translating the algorithm into code was easy enough, except the results were not as expected. I wanted something that could give me some visual feedback so I could iterate on the code to make it faster.
Since the branching factor for this graph is 2, the total depth can get rather large. While Neo4j's browser-based visualization is great for small to medium-sized graphs, I wanted to see things in three dimensions.
Using a blog post by my colleague Michael Hunger, located here, I had a way to see how my algorithm was growing over time and apply tweaks and heuristics to make it perform better in training phase.
 |
| 2D Graph Visualization in Neo4j Browser |
Using a blog post by my colleague Michael Hunger, located here, I had a way to see how my algorithm was growing over time and apply tweaks and heuristics to make it perform better in training phase.
3D graph visualization of a pattern recognition algorithm training into a massive binary decision tree. #Neo4j http://t.co/Llh0olPH1p
— Kenny Bastani (@kennybastani) July 2, 2014
I recorded my most recent iteration of the algorithm, which I wrote in Java, and created a GIF out of it. If you play the GIF in the tweet you can see how my algorithm expands over time.
I also uploaded a video that was a screen recording of the training phase of the algorithm at a slower speed.
I also uploaded a video that was a screen recording of the training phase of the algorithm at a slower speed.
Creating these kinds of visualizations were both fun and helpful to understand how the algorithm was evolving over time. I could understand better the computational performance and feasibilities of my various approaches and choose the best approach based on feedback from the visualizations.
In an upcoming blog post I will take this algorithm further to create a Neo4j plugin that performs image recognition and classification. The killer use case for this being an open-source deep learning plugin for Neo4j that can be used for face and object recognition in image data.
References:
Ubigraph: http://ubietylab.net/ubigraph/
Neo4j: http://www.neo4j.com/


No comments :
Post a Comment
Be curious, I dare you.